Endangered Species Recovery Program | |
|
Home | News | Publications | Species profiles | Data and maps | About | Staff | Links | Department of Biological Sciences | CSU Stanislaus |
IV. PHYSICAL IMPACTS
A. Tranquillity Site
1. Tranquillity Site Geology
The Tranquillity Demonstration Project site is located in the western San Joaquin Valley, an asymmetrical basin bounded by the Coast Ranges on the west, the Tehachapi Mountains on the south, the Sierra Nevada on the east and the delta of the San Joaquin and Sacramento Rivers on the north. The axis of the valley trough is closer to the Coast Ranges than to the Sierra Nevada. The basin is filled with alluvium overlying older Mesozoic and Cenozoic marine and continental sediments. Alluvial deposits underlying the central San Joaquin Valley were shed from the adjacent Coastal and Sierra Nevada ranges and vary in thickness from 900 to 3,300 ft (Miller et al.1971). The Sierra Nevada consists mainly of granitic and metamorphic rocks of pre-Tertiary age. The Coast Ranges are composed primarily of folded and faulted beds of Cretaceous age marine shale and sandstone in the north and Cenozoic age sandstone and shale in the south (Prokopovich 1987). Bull (1964a and b), identified a series of alluvial fans derived from sediments from the coastal ranges that form the western margin of the San Joaquin Valley in the study area.
The Tranquillity demonstration site is located in the trough of the San Joaquin valley in Western Fresno County. The site is underlain directly by flood basin deposits derived from overbank deposition from the San Joaquin River and Fresno Slough. The flood basin deposits consist of fine textured, moderately to densely compacted clays that range in thickness from 5 to 35 ft (Belitz and Heimes 1990). The flood basin clays have low permeability and greatly impede the downward movement of water. On the northern part of the site (in Section 10), the flood basin deposits rest upon well sorted micaceous sand derived from the Sierra Nevada . The Sierran sands are highly permeable, reduced in oxidation state, and vary in thickness between 400 to 500 ft in the project vicinity. On the southern part of the site (in Sections 15 and 16), the flood basin deposits overlie sediments derived from the coastal ranges. The coastal range sediments inter-finger with Sierran sands in the project vicinity, and are oxidized and primarily fine grained. The Corcoran clay is a regionally extensive fine grained lake bed deposit that underlies the site at a depth of approximately 500 ft.
2. Tranquillity Site Soils
Soils in the Tranquillity Demonstration Project area consist of clays and loams, which formed in alluvium, derived from igneous and sedimentary rock. Individual soil mapping units in order of abundance in the project area include the Tranquility clay, Lillis Clay, and the Lethent Silt Loam. The Tranquility mapping unit is the predominant soil type in the study area and covers approximately 80% of the site, while the Lillis and Lethent mapping units occur exclusively in Section 10 and cover the remainder of the site (Figure 37). The Tranquility clay is a very deep, poorly to moderately drained saline-sodic soil found on low-lying alluvial fans and flood plains with slopes between 0 and 1%. The permeability of this soil is slow and the unit is suited to growing irrigated, salt-tolerant crops, or for wildlife habitat (USDA 1996). Runoff is low, and the hazard of water erosion is slight. The depth to the water table varies and is commonly highest during irrigation applications in the winter and early spring. These soils generally require intensive management to reduce salinity and maintain agricultural productivity. The USDA took soil samples from a test pit located in the NW 1/4 of Section 16 at the site in 1992. The samples were analyzed in the laboratory for particle size, chemistry and mineralogy. These soils consist predominantly of clay sized particles less than 0.002 mm in diameter. The USDA reported that the clay fraction from 6 samples taken from the test pit ranged from 48 to 52% of the total samples. Silt size particles (0.002-0.05 mm in diameter) ranged from 36-37% of the total samples, and sand size particles made up from 11-16% of the total samples (USDA 1992). Total Selenium concentrations ranged from 0.5 to 1.1 ppm, and the Electrical Conductivity (EC) of soil water extracts ranged from 3.7 to 10.9 deciSiemens/meter (dS/m). These soils are highly plastic with Plasticity Indices ranging from 23-52%. The predominant clay mineral is Montmorillonite, which can take on water in the crystal lattice, resulting in high shrink-swell potential and development of deep cracks at the soil surface upon drying.
The Lillis clay mapping unit covers about 10% of the study area in the eastern half of Section 10 (Figure 37). These soils are very deep, poorly drained, saline-sodic soils found typically on floodplains and basins. Permeability of the Lillis soil is extremely slow, water infiltration rate is high, and when the soil is dry the surface cracks open. As the soil becomes wet and the cracks close, the infiltration rate greatly decreases. Surface water runoff is low and the hazard of water erosion is slight. The unit is used mainly for wildlife habitat and recreation. The USDA took soil samples from a test pit located in the SW 1/4 of Section 10 at the site in 1992. The samples were analyzed in the laboratory for particle size, chemistry and mineralogy. These soils consist predominantly of clay sized particles less than 0.002 mm in diameter. The USDA reported that the clay fraction from nine samples taken from the test pit ranged from 59 to 66% of the total samples. Silt-size particles (0.002-0.05 mm in diameter) ranged from 29-36% of the total samples, and sand-size particles made up from 2-7% of the total samples (USDA 1992). Total Selenium concentrations ranged from 0.3 to 0.7 ppm, and the EC of soil water extracts ranged from 9.6 to 38.6 dS/m. These soils are highly plastic with Plasticity Indices ranging from 33-61%. The predominant clay mineral is Montmorillonite, which can take on water in the crystal lattice, resulting in high shrink, swell potential.
The Lethent silt loam mapping unit covers about 10% of the site in the north half of Section 10 (Figure 37). These soils are deep, moderately well drained, saline-sodic soil found on low lying alluvial fans and basin rims. Permeability of this soil is very slow, runoff is slow, and the hazard of water erosion is slight (USDA 1996).
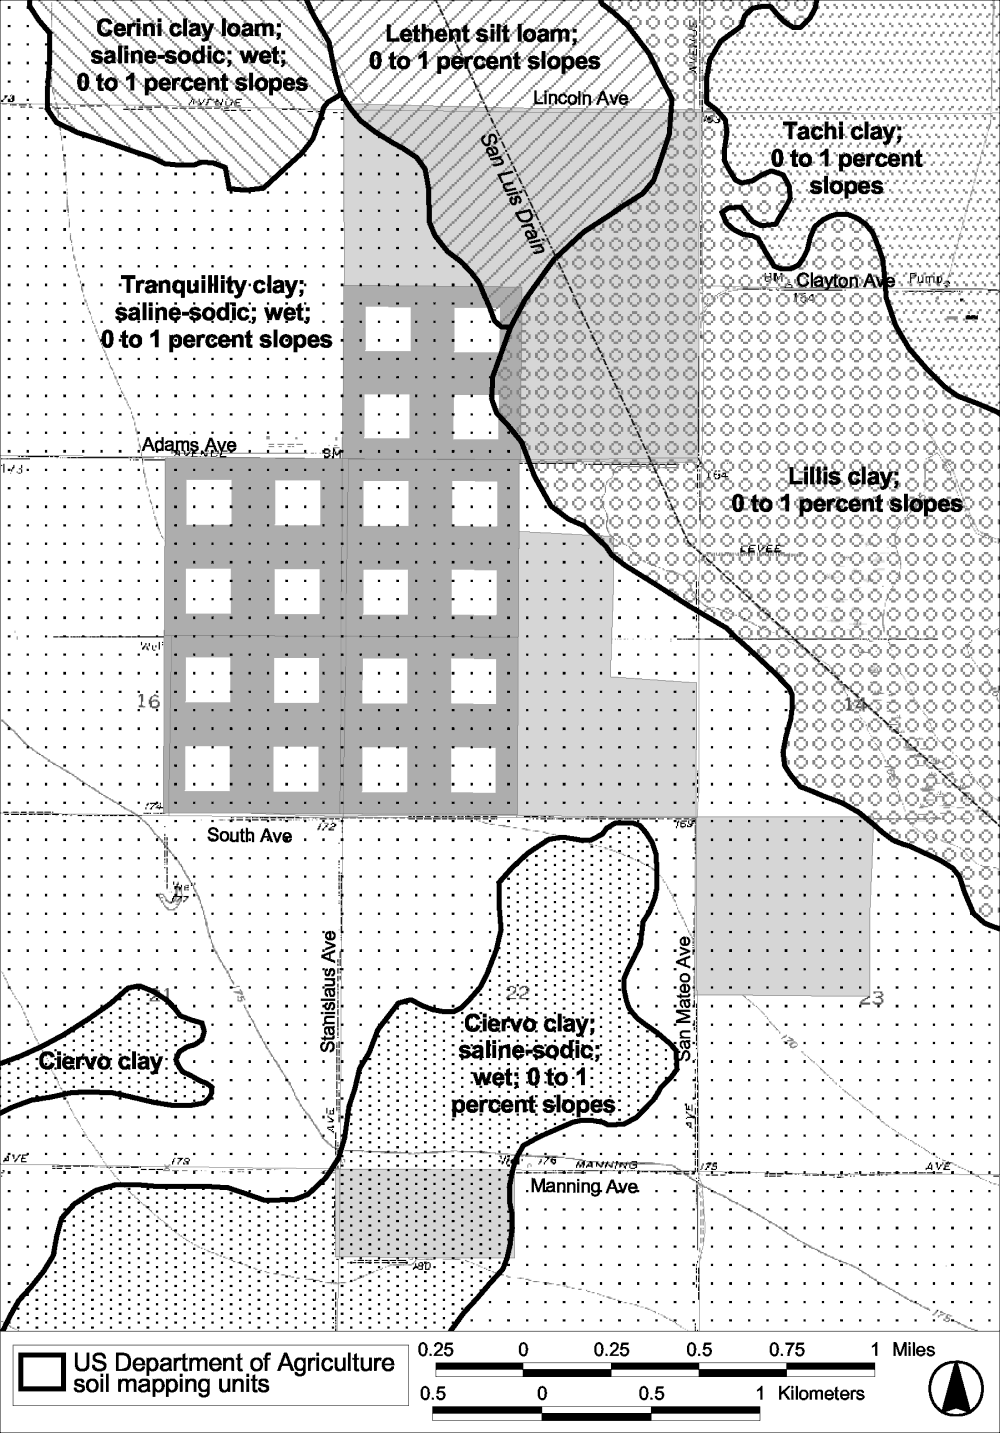
Figure 37.
U.S. Department of Agriculture soil mapping units, Tranquillity
site.
a. Soil Sampling: Tranquillity Site
The objective of the soil monitoring program for the demonstration project is to detect changes in levels of soil selenium, boron, and salinity that may result from land retirement over the 5-year life of the demonstration project. Baseline soil sampling was carried out by members of the Inter- Agency Land Retirement team during September and October, 1999. Analyses of baseline soil data for the Tranquillity site can be found in the calendar year 2000 annual report. This report is available on the USBR website at http://www.mp.usbr.gov/regional/landret/2000annrpt/html/index.html or by request from Mr. Robert May, the USBR Land Retirement Program Manager.
3. Weather: Tranquillity Site
Hourly precipitation, temperature, wind and relative humidity data are collected at the California Irrigation Management Information System (CIMIS) weather station # 105, which is located 1.5 miles west of the demonstration project site at the Westlands Water District (WWD) Tranquillity Field Office. The CIMIS station is operated and maintained by the California Department of Water Resources (CDWR), and can be used to guide crop irrigation scheduling and estimate consumptive water use for various crops. A total of 8.9 inches of rainfall was recorded at the CIMIS station, with most of the rainfall occurring between January and June (Table 46).
Table 46 . Monthly CIMIS weather data and estimated barley crop water use at the Tranquillity site for calendar Year 2001.
|
Month (2001) |
Reference evapotranspiration (inches) |
Barley crop coefficient |
Estimated evapotranspiration barley (inches) |
Measured precipitation (inches) |
|---|---|---|---|---|
|
January |
1.46 |
0.3 |
0.44 |
1.69 |
|
February |
1.98 |
1.18 |
2.34 |
1.06 |
|
March |
4.00 |
1.18 |
4.72 |
0.40 |
|
April |
5.30 |
1.18 |
6.25 |
0 |
|
May |
9.69 |
0.40 |
3.88 |
2.26 |
|
June |
9.84 |
0.20 |
1.97 |
0.78 |
|
July |
8.46 |
Not applicable |
0 |
0 |
|
August |
8.26 |
Not applicable |
0 |
0 |
|
September |
6.39 |
Not applicable |
0 |
0.02 |
|
October |
4.56 |
Not applicable |
0 |
0 |
|
November |
1.98 |
Not applicable |
0 |
1.39 |
|
December |
1.01 |
Not applicable |
0 |
1.28 |
|
Total |
62.93 |
8.88 |
The following paragraph is an excerpt taken from the California Department of Water Resources website (http://www.dpla.water.ca.gov/cimis/cimis/hq/etoexpl.txt) that defines the concept of a reference evapotranspiration.
A daily reference evapotranspiration (ETo) is calculated from the CIMIS weather data by the DWR. ETo is a term used to estimate the evapotranspiration rate of a reference crop expressed in either inches or millimeters. The reference crop used for the CIMIS program is grass, which is close clipped, actively growing, completely shading the soil, and well watered. ETo varies by location, time, and weather conditions. The main factors that influence ETo include incoming radiation (energy from the sun), outgoing radiation (sensible energy leaving the earth), the amount of moisture in the air, air temperature, and wind speed (DWR 2000). The ET value can be used to estimate the consumptive water demand of an agricultural crop. ETo can be estimated quite accurately through the use of a "model" (a series of mathematical equations). The "model" that is used in CIMIS is a version of Penman's equation modified by Pruitt/Doorenbos (Proceedings of the International Round Table Conference on "Evapotranspiration", Budapest, Hungary 1977). It also employs a wind function developed at UC Davis. The version used in CIMIS uses hourly weather data to calculate daily ETo instead of daily weather data. Hourly averages of weather data are used in the "model" to calculate an hourly ETo value. The 24 hourly ETo values for the day (midnight to midnight) are summed to result in a daily ETo (DWR 2000). Hourly values of net radiation, air temperature, wind speed and vapor pressure are the inputs used to calculate ETo. Air temperature, wind speed, and vapor pressure are measured directly at each weather station. Hourly net radiation is estimated using a method developed by the University of California. This method uses solar radiation, vapor pressure, air temperature, and a calculated monthly cloud coefficient (DWR 2000).
Monthly barley crop consumptive water use exceeded precipitation at the site during the calendar year 2001 in all months except January (-1.25 inches), November (-1.39 inches), and December (-1.28 inches; Figure 38, Table 46). Due to dry soil conditions, the timing of the rainfall, and evapotranspiration by plants most of the moisture from precipitation probably either evaporated or was added to the soil moisture reservoir and thus did not contribute toward deep percolation (recharge) to the shallow groundwater. Continued declining groundwater level trends observed in the shallow monitor wells and sumps at the site during calendar year 2001 support this inference.
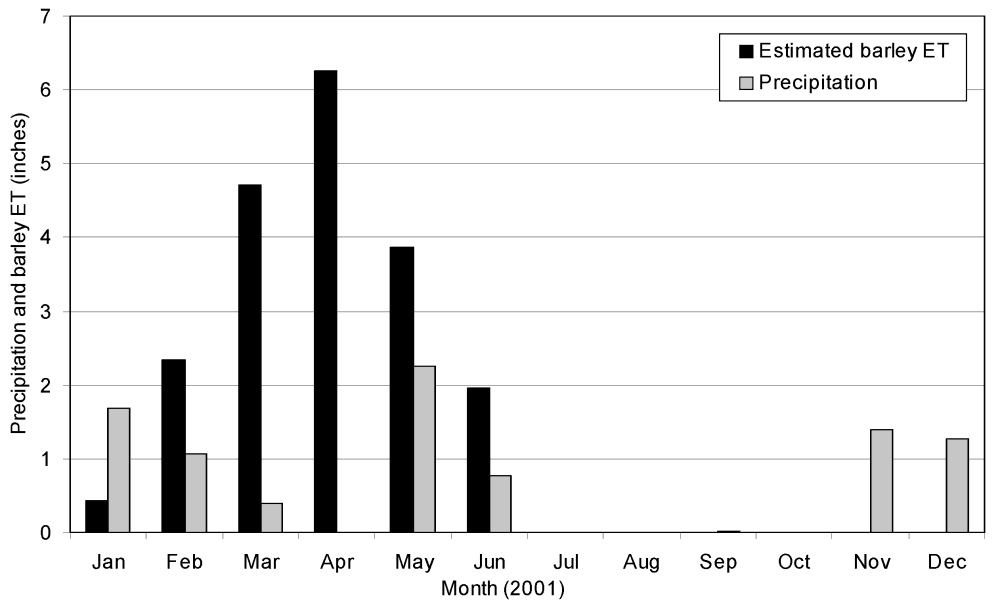
Figure 38.
Monthly precipitation and estimated barley crop consumptive
water use for calendar year 2001 at the Tranquillity site.
4. Irrigation: Tranquillity Site
A cover crop of barley was planted at the Tranquillity site to provide weed and dust control and to isolate the experimental plots from each other. Approximately 367 acre feet of water was applied to 960 acres of the barley crop in 2001, resulting in an average of approximately 4.6 inches of water applied per acre. Water was applied to the 960 acres of barley using a hand moved sprinkler irrigation system in 12 hour sets during the time period from March 15 to April 30, 2001. The barley crop consumptive water use exceeded precipitation and applied irrigation water during the irrigation period (Table 47), thus it is unlikely that the irrigation application contributed to recharge to the perched water table. Continued declining groundwater level trends observed in the shallow monitor wells and sumps at the site during calendar year 2001 support this inference. Approximately 0.25 acre foot of water was also applied to a linear hedgerow planting located on the west side of Section 23.
Table 47. Estimated barley crop consumptive water use as compared with precipitation and applied irrigation water at the Tranquillity site.
|
Month |
Estimated barley ET (inches) |
Precipitation (inches) |
Applied irrigation (inches) |
Irrigation deficit (inches) |
|---|---|---|---|---|
|
March |
4.7 |
0.4 |
2.3 |
2.0 |
|
April |
6.3 |
0 |
2.3 |
4.0 |
5. Hydrology and Surface Water Monitoring: Tranquillity Site
No surface water ponding was observed at the site during the calendar year 2001, and thus no surface water samples were taken for chemical analysis. The natural drainage at the site is to the east and northeast with ground surface elevations ranging from 169 ft above mean sea level (AMSL), in the southwest corner of the site to about 162 ft AMSL in the northeast portion of the site. The land surface in most of the study area has been laser leveled to facilitate irrigation of row crops. There are no perennial surface water bodies on the site. Shallow ephemeral surface water ponds may form on low lying portions of the study area due to localized sheet-flow runoff during prolonged winter storm events. Surface water courses within the area consist principally of irrigation supply canals, and irrigation return flow ditches. Three irrigation tailwater ditches traverse the site on Sections 15 and 16. Tailwater is irrigation water that does not penetrate the soil, and runs off the irrigated cropland. Tailwater is usually collected in a surface water pond and recirculated into the irrigation system. Fresno Slough, which is located approximately 1 mile east of the study area, is the largest perennial surface water body in the vicinity of the project. Fresno Slough receives flood flow releases from the North Fork of the Kings River and serves as a storage reservoir for irrigation water conveyed via the Delta Mendota Canal. Fresno Slough also occasionally receives flood flows from Panoche Creek, which rises in the Coast Ranges to the west, and flows out onto the Panoche Fan during winter storm events.
6. Groundwater Level Monitoring: Tranquillity Site
One of the primary objectives of the Demonstration Project is to measure the response of the shallow water-table to land retirement. There are approximately 50 monitor wells and three drain sumps in the project vicinity that are used to measure groundwater levels beneath the site on a quarterly basis. The well and sump locations are shown on Figure 39. Existing wells constructed prior to the 1998 purchase of the demonstration project lands were installed by Westlands Water District (WWD) and the Bureau of Reclamation (USBR) for the primary purpose of measuring depths to groundwater beneath drainage impacted lands in WWD. These existing wells are constructed of PVC casing ranging in diameter from 0.75 to 4 inches and vary in depth from 3 to 86 ft below the ground surface. These wells were installed using various construction techniques that range from jetting a short length of pipe into the ground to standard rotary drilling with hydraulic drill rigs. During the summer of 1999, the USBR installed 15 additional wells for the purpose of measuring groundwater levels and obtaining representative groundwater samples for water quality analyses for the Land Retirement Demonstration. The new wells were installed using a hollow stem auger drill rig and are constructed of 2-inch PVC casing. Well construction diagrams for the new wells are on file at the USBR office in Fresno, California. Well construction diagrams for the previously existing wells are unavailable. There also are18 subsurface drain water collection sumps located in a north to south alignment bisecting the northern half of Section 15 at the site. The sumps are part of an experimental drainage system that was installed at the site during the 1960's. Subsurface tile drains lines were installed beneath the northwest quarter of Section 15 at a depth of approximately 8 ft, with a drain spacing of approximately 150 ft. The drain lines are approximately 6 inches in diameter and discharge to 3-foot diameter concrete sumps that are open to the atmosphere. Water levels have been measured quarterly in three of the drain sumps at the site (Figure 39).
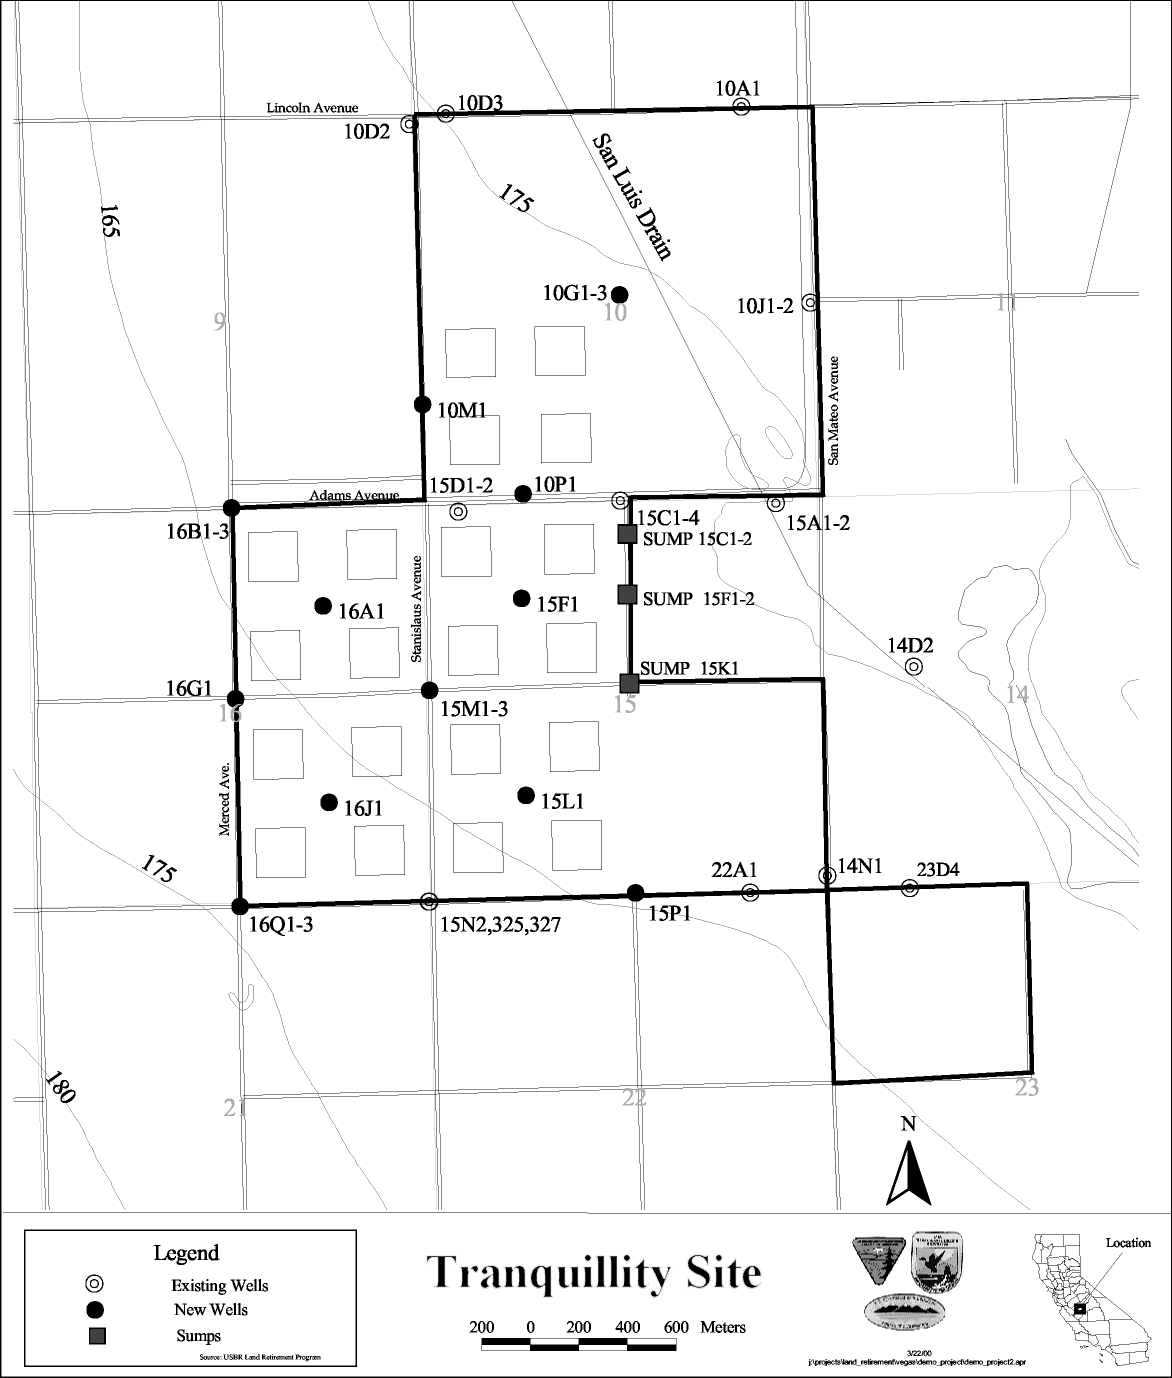
Figure 39.
Monitor well and sump location map, Tranquillity site.
7. Groundwater Response to Land Retirement: Tranquillity Site
Groundwater level data collected at the demonstration site as of this date supports the conceptual model of a declining shallow groundwater table in response to land retirement. Declining water level trends have been the norm for the wells monitoring the shallow perched groundwater system at the site since the land was retired from irrigated agriculture in August, 1998. A hydrograph is a commonly used method to graphically display groundwater level trends observed in monitor wells. Hydrographs are time series plots of water levels measured in monitor wells. A declining trend in groundwater levels for the shallow perched groundwater system at the site is illustrated by the hydrographs shown in Figure 40. The hydrographs represent water levels measured in three drain sumps (15C1, 15F2, 15K1) during the time period from July 1998 to July 2000. The drain sumps are connected to tile drain lines that underlie the northwest quarter of Section 15, and are useful for measuring shallow groundwater trends in that portion of the site. The drain sump locations are shown on Figure 39. All three of these sumps show an overall declining trend in groundwater levels for the period of record. Total water-level declines observed in sumps 15C1, 15F2, and 15K1 are 4.5, 3.0, and 2.4 ft, respectively. Sumps 15C1 and 15 F2 were observed to be completely dry starting in January, 2000, while sump 15C1 was observed to be completely dry starting in October, 2000. The drain sumps have remained dry as of this date.
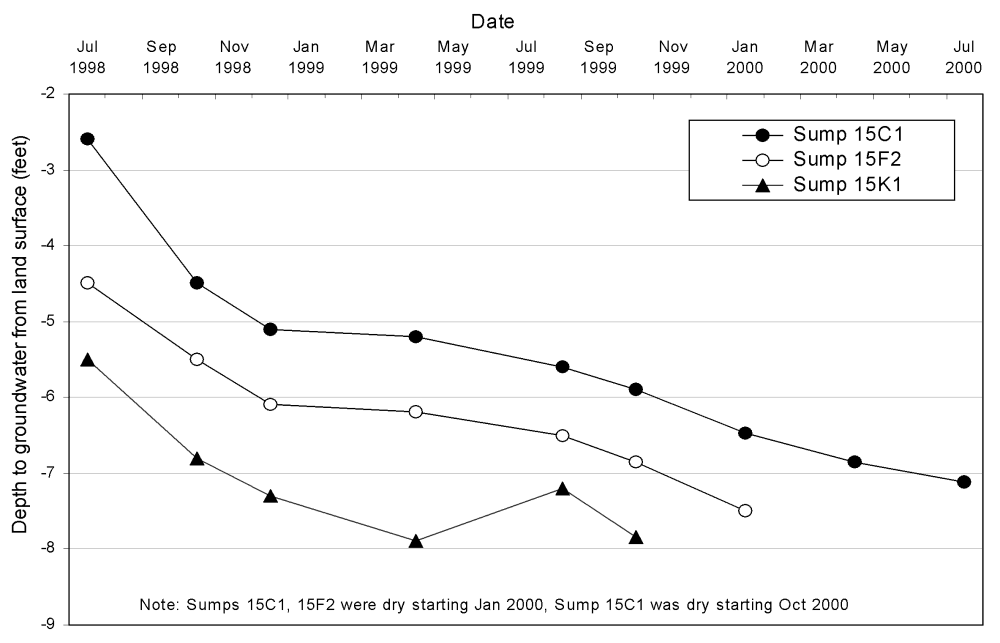
Figure 40.
Hydrographs for three agricultural drain sumps at the
Tranquillity site showing a declining shallow groundwater
trend
A declining water level trend has been observed in the southwest part of the site at monitor wells 325 and 326. The hydrographs and locations for these wells are shown in Figures 41 and 39, respectively. The total water-level declines observed in wells 325 and 326 for the period of record are 7.4 and 7.5 ft, respectively. A similar declining trend was observed in wells 15M1 and 16A1 (Figure 42). The total water-level declines observed in wells 15M1 and 16A1 were 5.2 and 6.1 ft, respectively.
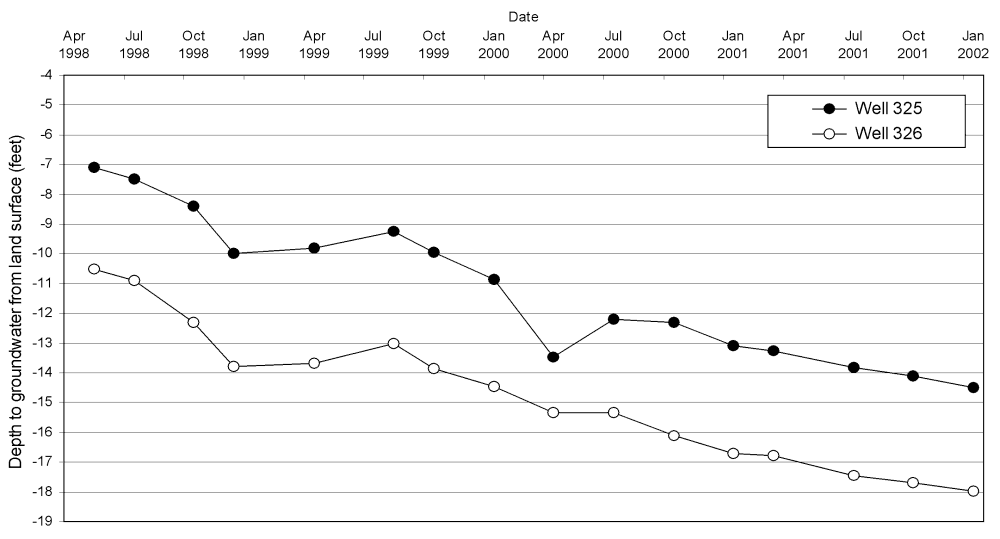
Figure 41.
Hydrographs for monitor wells 325 and 326 at the Tranquillity
site showing a declining shallow groundwater trend.
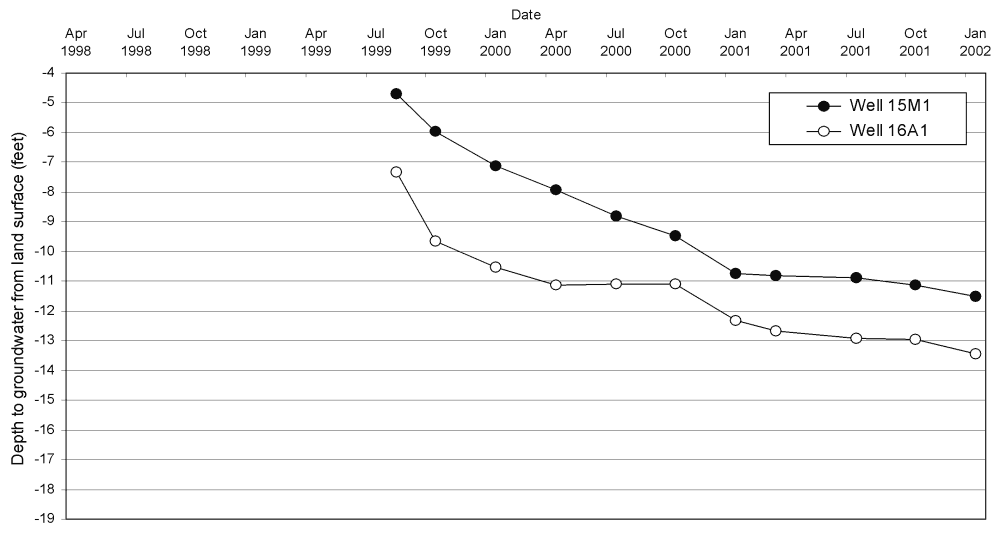
Figure 42.
Hydrographs for monitor wells 15M1 and 16A1 at the Tranquillity
site showing a declining shallow groundwater trend.
Synoptic depth to groundwater maps are another useful way to portray the decline of the shallow water-table beneath the Tranquillity site. Figures 43-45 show the depth to groundwater from the land surface as measured in monitor wells at the site in October, 1999, October, 2000, and October 2001, respectively. The measured depth to groundwater data was contoured using Environmental Systems Research Institute (ESRI) ArcView Spatial Analyst software to produce the maps. During October, 1999 approximately 30% (600 acres) of the site was underlain by a water-table within 7 ft of the land surface. During October, 2000 approximately 3% of the site (55 acres) was underlain by a water-table within 7 ft of the land surface. In October, 2001 the area of the site underlain by a water-table within 7 ft of the land surface decreased to less than 2% of the site (34 acres). Another aspect of the site hydrogeology shown by the synoptic maps is the fact that the site can be divided into two distinct areas based on the depth to groundwater observations. The depth to the water-table north of Adams Avenue (Section 10) is significantly greater than that observed south of Adams Avenue. The differences can be attributed to two factors. This area of the site (Section 10) has been retired from irrigated agriculture since 1994, and has not received significant application of irrigation water (groundwater recharge) since that time. Section 10 is also underlain by more permeable Sierran sand deposits, which allow more rapid percolation of applied irrigation water.
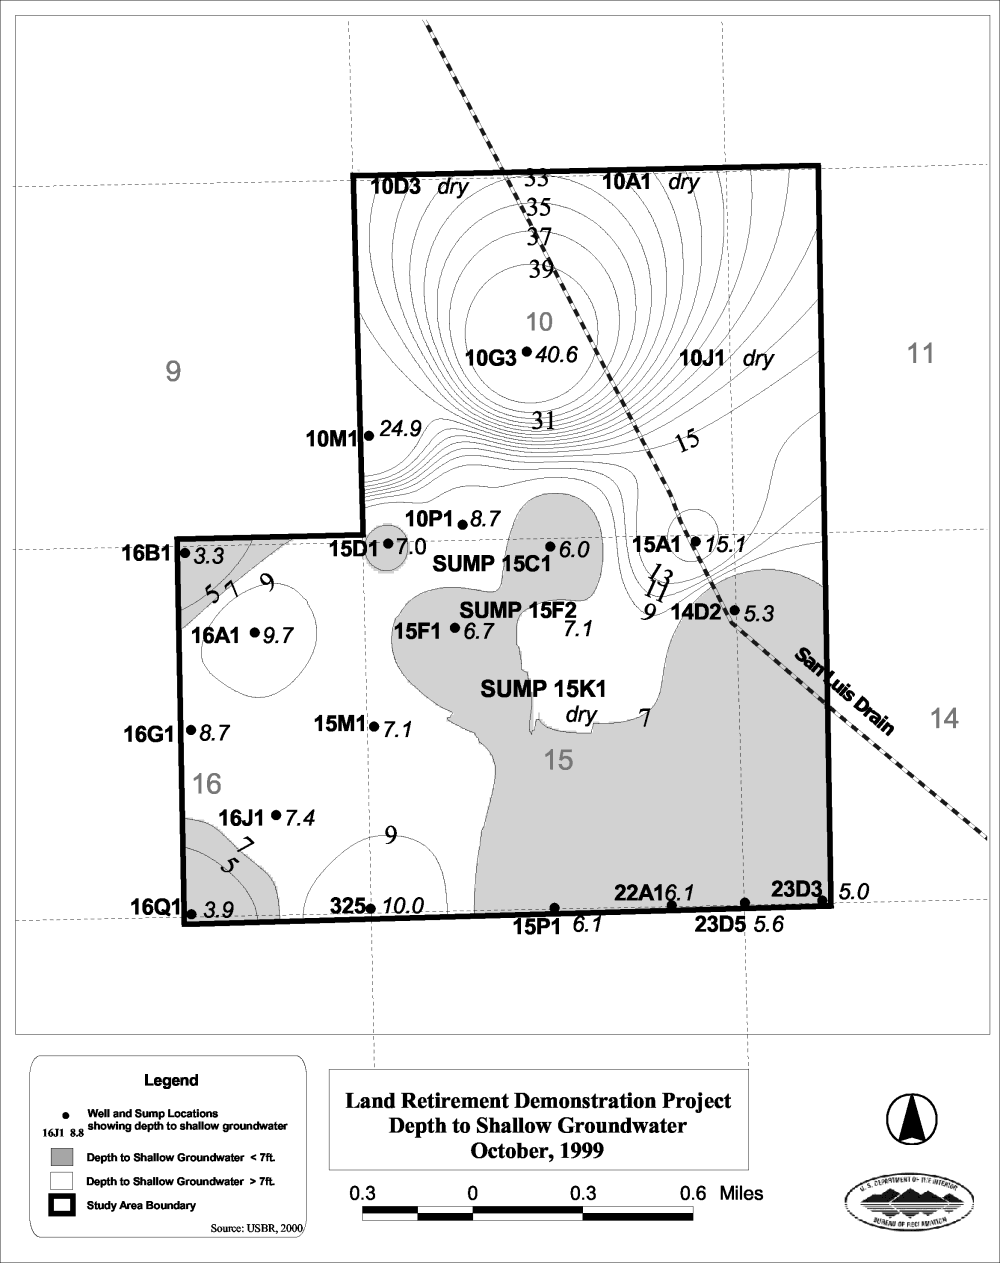
Figure 43.
Depth to shallow groundwater, October, 1999. The project area
underlain by shallow groundwater within 7 ft of the land
surface is approximately 600 acres.
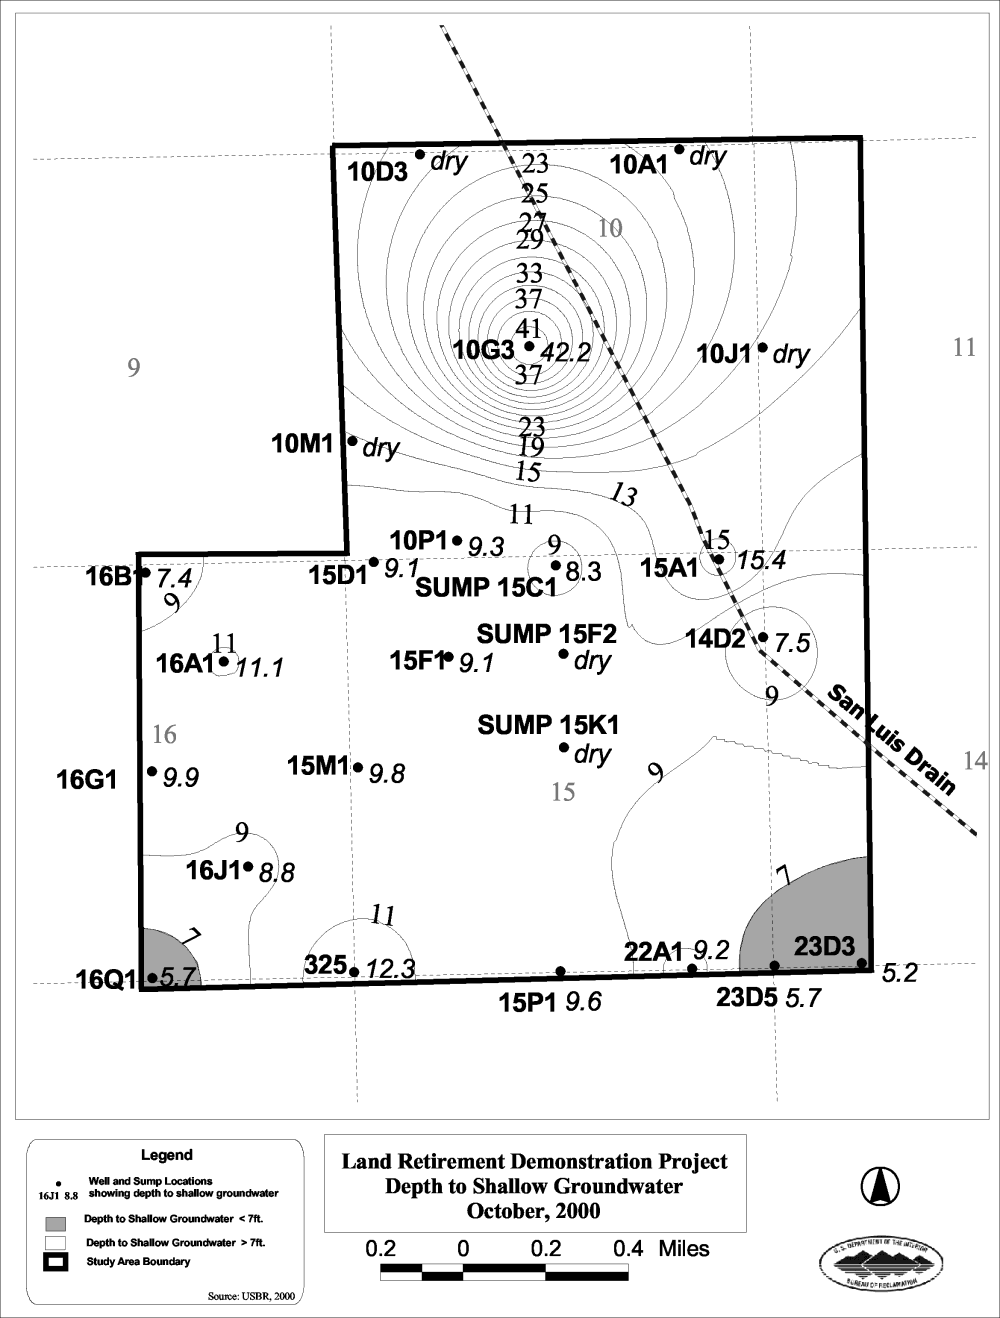
Figure 44.
Depth to shallow groundwater, October, 2000. The project area
underlain by shallow groundwater within 7 ft of the land
surface is approximately 55 acres.
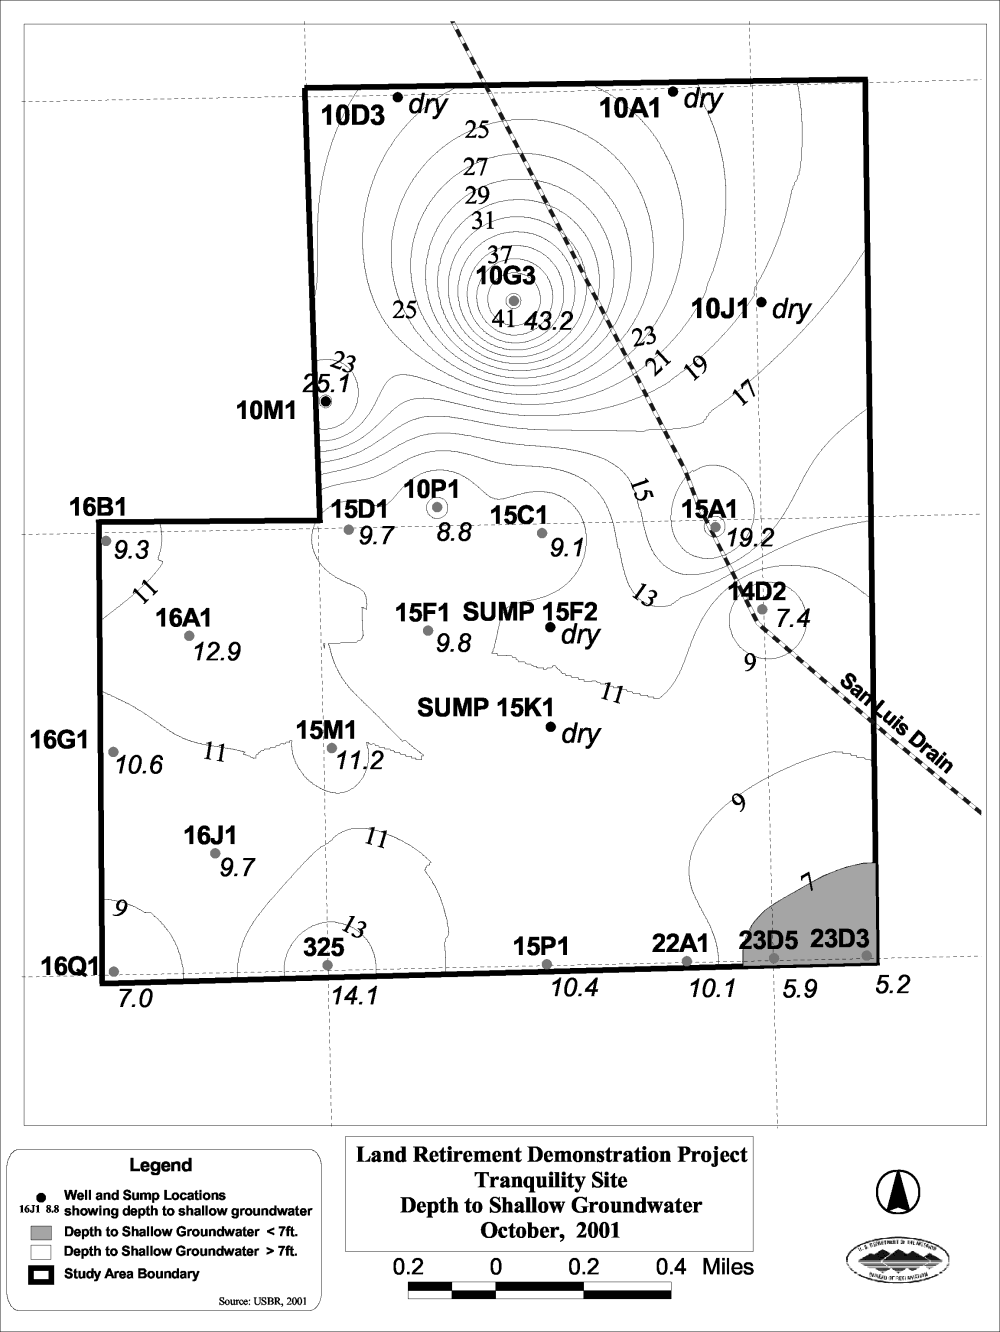
Figure 45.
Depth to shallow groundwater, October, 2001. The project area
underlain by shallow groundwater within 7 ft of the land
surface is approximately 34 acres.
The combinations of dry climatic conditions and greatly reduced irrigation applications associated with land retirement have resulted in significant shallow water-table declines at the Tranquillity demonstration site. Nearly all the monitor wells are showing a declining water level trend over time. The average drop in the shallow water table measured in 10 wells at the site during the first 2 years of monitoring is approximately 4 ft (Table 48). To conclusively demonstrate the cause and effect relationship between the declining shallow groundwater levels observed on site and land retirement, comparison with background or reference wells is warranted. Ideal background wells would be located in the project vicinity, with similar soils and geology, but in an area with active ongoing irrigation. An effort will be made to obtain data from appropriate offsite "background" wells for comparison with observed demonstration project groundwater levels.
Table 48. Groundwater level decline observed in ten wells at the Tranquillity site for the time period from August, 1999 to October, 2001.
|
Well |
Water level decline (feet) |
|---|---|
|
15P1 |
5.6 |
|
15L1 |
1.0 |
|
15M1 |
4.8 |
|
15F1 |
3.3 |
|
16G1 |
3.7 |
|
16Q1 |
4.4 |
|
16A1 |
5.6 |
|
16B1 |
5.8 |
|
15N1 |
4.9 |
|
15C1 |
2.7 |
|
Minimum |
1.0 |
|
Maximum |
5.8 |
|
Average |
4.1 |
8. Groundwater Quality Monitoring: Tranquillity Site
The purposes for selenium groundwater-quality monitoring at the site are to establish baseline conditions that can be used as a basis for comparison for change-detection analyses, and to collect data that can be used to evaluate exposure risk to wildlife via the groundwater pathway. Baseline groundwater samples were taken on a quarterly basis during year 1 of monitoring at the Tranquillity site. The baseline groundwater quality samples were taken in October 1999 and February, May, and July 2000. Annual groundwater sampling began at Tranquillity in May 2001, and will continue for the 5- year duration of the project. The springtime sampling was chosen to coincide with the seasonal high water table in the region. The annual, groundwater-quality data will be compared to the baseline data set to evaluate changes in groundwater quality. Unfiltered groundwater samples were taken from 12 wells and two drain sumps to assess baseline groundwater quality at the site. Standard operating procedures for groundwater sampling used by the Mid-Pacific Region of the USBR and those outlined in the Quality Assurance Project Plan for the Land Retirement Demonstration Project (CH2M Hill 1999) were employed to obtain groundwater samples.
Unfiltered groundwater samples were analyzed for major ions (calcium, magnesium, potassium, sodium, chloride, sulfate, total alkalinity), trace elements (selenium, boron, iron, manganese) and isotopes (H -2 , O -18 and H -3 ). Specific conductance (electrical conductivity), pH, temperature, and turbidity of groundwater samples were measured in the field at the time of sampling. Flourometric analyses of groundwater samples for selenium were performed by Olsen Biochemistry Laboratories, South Dakota State University. Analyses for isotopes (H -2 , O -18 ) were performed by the USGS Water Resources Division laboratory in Reston, Virginia. Analyses for tritium (H -3 ) were performed by the USGS Water Resources Division laboratory in Menlo Park, California. All other analyses were performed by Caltest Analytical Laboratory in Napa, California. The Quality Assurance Project Plan (QAPP) for the Land Retirement Demonstration Project describes in detail the analytical procedures and quality assurance measures taken to ensure groundwater data quality (CH2M Hill 1999).
a. Groundwater Salinity: Tranquillity Site
A general indication of the total dissolved ionic constituents in the groundwater can be obtained by determining the capability of a groundwater sample to conduct an applied electrical current. This property is reported as specific conductance (also electrical conductivity, EC), and is expressed in terms of the conductivity of a cube of water 1 square centimeter on a side. EC is expressed in units of microSiemens/cm (µS/cm).
Baseline EC data for the groundwater samples collected during the first year of monitoring are presented in Tables 37 and 38. The shallow, perched groundwater is extremely saline in nature. Salinity in the shallow groundwater and drain sump samples, expressed as EC, ranged from 11,500 to 76,980 µS/cm, with a median value of 43,925 µS/cm. By comparison, drinking water typically is less than 750 µS/cm, irrigation water is less than 1,250 µS/cm, and seawater is about 50,000 µS/cm. The groundwater samples obtained from the underlying semi-confined aquifer is much less saline. Salinity in the groundwater samples obtained from the deep wells (> 50 ft deep), expressed as EC ranged from 5,630 to 18,580 µS/cm, with a median value of 7,675 µS/cm.
The extreme salinity of the shallow groundwater at the site is a result of the irrigation of saline soils. Naturally occurring salts have been leached from the soil profile under irrigated conditions. Salts also have been transported to the site in the applied irrigation water. Direct evaporation from the shallow water table and transpiration of applied water by crops has concentrated salts in the shallow groundwater, resulting in the high EC values observed in the shallow groundwater samples.
b. Groundwater Major Ion Chemistry-Tranquillity Site
Baseline major ion chemistry for the groundwater samples collected during year 1 of monitoring are presented in Tables 37 and 38 The groundwater comprising the shallow, perched water, and in the underlying semi-confined aquifer is best described as a sodium sulfate type of water. Sodium is the dominant major cation found in the shallow groundwater samples, with sodium concentrations ranging from 2,300 to 25,000 mg/l, and a median concentration of 13,000 mg/l. Sodium is also the dominant major cation found in groundwater samples taken from the deep wells, with concentrations ranging from 760 to 3,800 mg/l, and a median concentration of 1,100 mg/l. Sulfate is the dominant major anion found in both the shallow, perched groundwater and in the underlying semi-confined groundwater at the site.
Table 49. Groundwater quality data for shallow wells at the Tranquillity site - major ions and field parameters.
|
Statistic |
Minimum |
25th percentile |
Median |
75th percentile |
Maximum |
Mean |
|---|---|---|---|---|---|---|
|
Number of Samples |
44 |
44 |
44 |
44 |
44 |
44 |
|
EC(field) (µS/cm) |
11500 |
32620 |
43260 |
52350 |
76980 |
41987 |
|
pH (field) |
6.74 |
7.54 |
7.78 |
7.9 |
8.37 |
7.73 |
|
Calcium (mg/l) |
250 |
400 |
420 |
450 |
500 |
417 |
|
Magnesium (mg/l) |
42 |
250 |
525 |
663 |
1300 |
515 |
|
Sodium (mg/l) |
2300 |
8725 |
13000 |
16500 |
25000 |
13009 |
|
Potassium (mg/l) |
7 |
20 |
30 |
42 |
94 |
32 |
|
Total Alkalinity (mg/l) |
150 |
260 |
330 |
423 |
610 |
351 |
|
Chloride (mg/l) |
380 |
1150 |
2700 |
3200 |
4100 |
2332 |
|
Sulfate (mg/l) |
4300 |
|
24500 |
31000 |
62000 |
26330 |
Table 50. Groundwater quality data for deep wells at the Tranquillity site - major ions and field parameters.
|
Statistic |
Minimum |
25th percentile |
Median |
75th percentile |
Maximum |
Mean |
|---|---|---|---|---|---|---|
|
Number of Samples |
12 |
12 |
12 |
12 |
12 |
12 |
|
EC(field) (µS/cm) |
5630 |
6763 |
7675 |
17315 |
18580 |
10633 |
|
pH (field) |
6.82 |
7.13 |
7.21 |
7.28 |
7.46 |
7.21 |
|
Calcium (mg/l) |
280 |
300 |
320 |
360 |
390 |
327 |
|
Magnesium (mg/l) |
280 |
300 |
310 |
328 |
350 |
315 |
|
Sodium (mg/l) |
760 |
823 |
1100 |
2425 |
3800 |
1714 |
|
Potassium (mg/l) |
6 |
9 |
13 |
14 |
20 |
12 |
|
Total Alkalinity (mg/l) |
200 |
250 |
270 |
329 |
340 |
277 |
|
Chloride (mg/l) |
300 |
410 |
540 |
1700 |
1900 |
924 |
|
Sulfate (mg/l) |
2100 |
2750 |
3100 |
5525 |
7300 |
4067 |
Sulfate concentrations found in groundwater samples from the shallow wells (< 50 ft deep) ranged from 4,300 to 62,000 mg/l, with a median concentration of 24,500 mg/l. Sulfate concentrations in groundwater samples from the deep wells (greater than 50 ft deep) completed in the semi-confined aquifer ranged from 2,100 to 7,300 mg/l, with a median concentration of 3,100 mg/l (Figure 46).
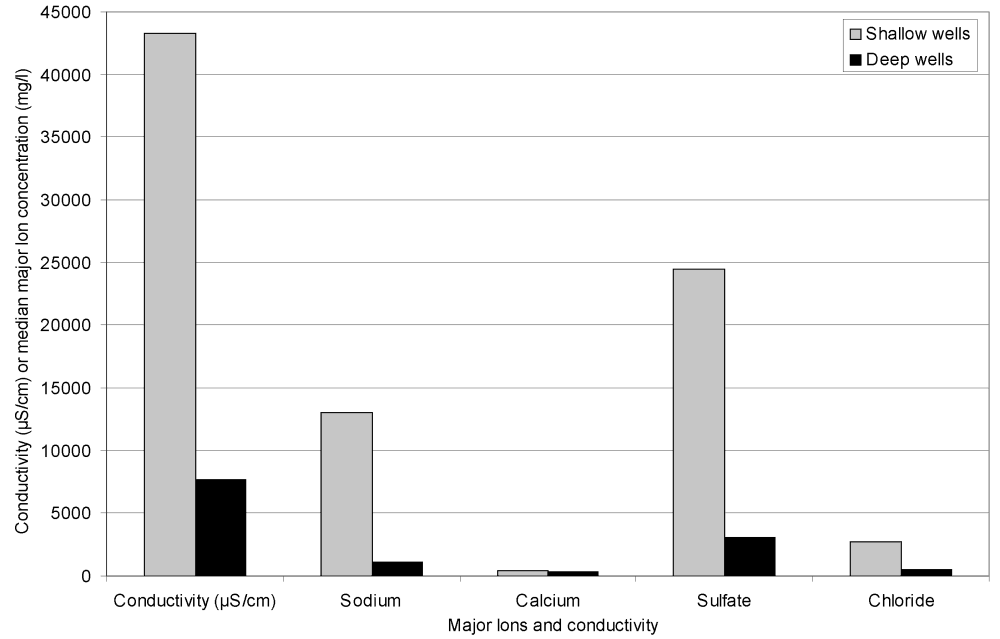
Figure 46.
Comparison of dominant major ion concentrations and electrical
conductivity for groundwater samples from shallow and deep
wells.
High sodium and sulfate concentrations in the groundwater on the west side of the San Joaquin Valley result from weathering of sulfate rich rocks in the adjacent Coast Ranges. Davis (1961) hypothesized that the sulfate in groundwater in the study region originates from the oxidation of organic marine shales containing reduced iron sulfide minerals. Presser et al. (1990) have reported oxidation of iron sulfide minerals for west-side streams in the study vicinity. Another probable source of sulfate in the shallow groundwater is gypsum (calcium sulfate) that has historically been applied to soils by farmers in the region as a method of salinity management.
c. Trace Elements in Groundwater - Tranquillity Site
The trace elements of concern monitored for this study include selenium and boron. High concentrations of selenium and boron in the shallow groundwater are of concern due to potential toxicity to wildlife and plants. Iron and manganese concentrations were also monitored because they provide insight into geochemical conditions in the groundwater system. A summary of baseline trace element data for the first year of groundwater monitoring is presented below.
Table 51. Groundwater quality data for shallow wells at the Tranquillity site - trace elements and tritium.
|
Statistic |
Minimum |
25th percentile |
Median |
75th percentile |
Maximum |
Mean |
|---|---|---|---|---|---|---|
|
Number of Samples |
44 |
44 |
44 |
44 |
44 |
44 |
|
Boron (mg/l) |
10 |
26 |
46 |
55 |
81 |
42 |
|
Iron (mg/l) |
0.1 |
0.8 |
2.1 |
15 |
160 |
19.4 |
|
Manganese (mg/l) |
0.008 |
0.11 |
0.23 |
1.1 |
3.9 |
0.757 |
|
Selenium (mg/l) |
0.005 |
0.195 |
1.28 |
3.812 |
5.39 |
2.095 |
|
Tritium (TU) |
0 |
0.9 |
2.4 |
3.7 |
6 |
2.3 |
Table 52. Groundwater quality data for deep wells at the Tranquillity site - trace elements and tritium.
|
Statistic |
Minimum |
25th percentile |
Median |
75th percentile |
Maximum |
Mean |
|---|---|---|---|---|---|---|
|
Number of Samples |
12 |
12 |
12 |
12 |
12 |
12 |
|
Boron (mg/l) |
2.5 |
2.8 |
3.2 |
6.6 |
8.3 |
4.4 |
|
Iron (mg/l) |
0.3 |
0.6 |
1.2 |
1.3 |
1.6 |
1 |
|
Manganese (mg/l) |
0.25 |
0.318 |
1.75 |
2.5 |
4.3 |
1.718 |
|
Selenium (mg/l) |
< 0.0004 |
0.0005 |
1.84 |
1.91 |
1.95 |
1.0873 |
|
Tritium (TU) |
0 |
0.4 |
10.1 |
11.6 |
14 |
7.5 |
d. Selenium in Groundwater - Tranquillity Site
Selenium concentrations measured in the shallow groundwater wells and sumps (less than 50 feet deep) at the site during the first year of monitoring show considerable spatial variation. In general, selenium concentrations in the shallow groundwater system are high, ranging from 5 to 5,390 µg/l (0.005 to 5.390 mg/l), with a median concentration of 1,280 µg/l (1.280 mg/l). By comparison, the USEPA water-quality criteria for long-term exposure in aquatic environments is 5 µg/l (USEPA 1988). It becomes clear why the conceptual model of a declining shallow water-table is an essential element of land retirement in light of the extremely high concentrations of selenium observed in the shallow groundwater. If these waters were exposed at the land surface, wildlife could be exposed to potentially toxic conditions. Deverel and Millard (1988) concluded that the main factors affecting selenium concentrations in the shallow groundwater of the western San Joaquin Valley are the degree of groundwater salinity and the geologic source of the alluvial soils.
Selenium concentrations measured in the deep wells (> 50 ft deep) at the site also show considerable spatial variation. Selenium concentrations found in well 15M3 (69 ft deep), ranged from 1,840 to 1,950 µg/L during the first year of monitoring, while selenium concentrations found in Wells 15C3 and 10G3 (83 and 75 ft deep, respectively) range from the analytical limit of detection (less than 0.0004) to 0.0005 µg/l. The extreme variation in selenium concentration seen in the deep wells may be explained due to differing geochemical conditions found in Coast Range deposits and the Sierran sands underlying the site. Well 15M3 is perforated in coast range sediments, while wells 15C3 and 10G3 are perforated in sediments derived from the Sierra Nevada Range. Dubrovsky et al. (1993) noted high concentrations of selenium in shallow groundwater in Coast Ranges sediments, and low concentrations in underlying Sierra Nevada sediments in previous groundwater quality investigations in the western San Joaquin Valley. The authors hypothesized that the absence of selenium in groundwater from wells screened in the Sierra Nevada deposits may be due to a redox (chemical reduction or oxidation) process. Selenium can exist in four valence states; -2, 0, +4, and +6. The +6 and +4 valences occur as the oxyanions selenate (Se O 4 2- ) and selenite (SeO 3 2- ) under alkaline, oxidizing conditions. Selenate is the most oxidized form of selenium, is relatively mobile in aqueous environments, and does not associate with solid phase materials (Leckie et al. 1980, Frost and Griffin 1977, and Hingston et al. 1974). Deverel and Fujii (1988) reported that the selenium in soil solutions and shallow groundwater in the western San Joaquin Valley is in the selenate form, and a very small percentage of soil selenium is in the absorbed phase. Although no attempt has been made to speciate selenium in groundwater samples from the Land Retirement Demonstration Project, the selenium found in the shallow groundwater at the site probably occurs predominantly as selenate. Under more reduced conditions, such as those found in the underlying Sierra Nevada deposits in the northern part of the site, selenium can exist as elemental selenium (zero valence) and selenide (Se 2- ). The solubility of selenate minerals generally is high (Elrashadi et al. 1987), and there are no apparent solubility constraints on selenate in shallow groundwater in the western San Joaquin Valley, even in groundwater saturated with respect to sulfate minerals (Deverel and Gallanthine, 1989). Consequently, selenate tends to behave conservatively in oxidizing groundwater. The mobility of selenite in groundwater is severely constrained by adsorption onto a variety of mineral surfaces (Balistrieri and Chao 1987, Neal et al.1987, Goldberg and Glanbig 1988) The solubilities of the reduced forms of selenium (elemental selenium and selenide) are extremely low (Elrashadi et al. 1987). Field and laboratory studies of selenium contamination at Kesterson Reservoir demonstrated selenium removal by reduction of selenate to less mobile forms (Lawrence Berkeley Laboratory 1987, White et al. 1988, Weres et al. 1989). Similar geochemical processes may be responsible for the extremely low selenium concentrations observed in Wells 15C3 and 10G3 at the Tranquillity site.
Dubrovsky et al. (1993) noted that selenium concentrations in groundwater decreased rapidly at the same depth at which manganese concentrations increase at a research site located in the vicinity of the Tranquillity site in the western San Joaquin Valley. The authors concluded that the decrease in selenium is due to a process that occurs under reducing conditions. High concentrations of dissolved iron and manganese in groundwater can indicate geochemically reducing conditions. A similar trend is observed at the land retirement study site when ratios of selenium to manganese concentrations are plotted verses well depth. The selenium/manganese ratios are generally high in the shallow wells and extremely low in the deep wells, especially those perforated in the Sierran deposits (Figure 47). This supports the conceptual model that oxidizing conditions are prevalent in the shallow groundwater, and that reducing conditions are prevalent in the deep groundwater found in the Sierran deposits. Reducing geochemical conditions in the Sierran deposits probably play a significant role in the extremely low selenium concentrations observed in wells 15C3 and 10G3.
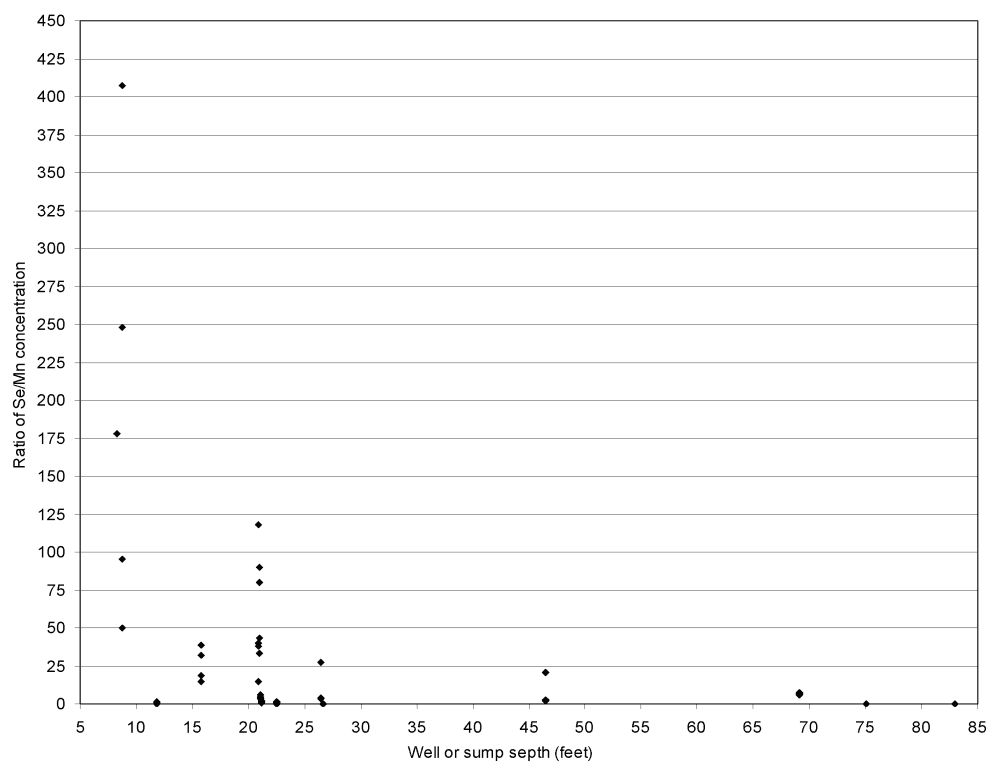
Figure 47.
Ratio of Selenium to Manganese (Se/Mn) concentration in
groundwater samples plotted verses well depth. The Se/Mn ratio
shows a decreasing trend with depth indicating oxidizing
geochemical conditions in the shallow wells and reducing
conditions in the deep wells.
ite
The US Fish and Wildlife Service (USFWS) established performance standards for retired lands in the Recovery Plan for Upland Species of the San Joaquin Valley (USFWS 1998). The performance standard for selenium in groundwater specifies that the selenium concentrations should not show an increasing trend over 5 years of monitoring. The high spatial variability of the selenium data observed for the groundwater at the Tranquillity site precludes the comparison of mean or median values for the entire set of monitor wells due to the limited sample size. Given the variability of the baseline selenium data, over 200 wells would be required to accurately estimate the population mean concentration of selenium in the shallow groundwater at a given time. A time series analysis at each monitor well will be used to establish trends for selenium concentrations in the groundwater at the site. To establish reliable time series trends, autocorrelation or autoregression analyses will be performed on the time series data from each well. Both of these techniques require relatively long-term data records based on evenly spaced data. There currently are not enough data to draw any statistically meaningful conclusions regarding the trend of selenium concentrations in the groundwater. The current data consist of four quarterly samples obtained during year 1 and one sample obtained during year 2 of monitoring. Preliminary analysis of time series data from 11 wells at the site show a decreasing trend for 4 wells and an increasing trend for 7 wells. Only the increasing trends observed at wells 16J1 and 16Q1 are significant at the 95% confidence level (Table 53). The additional annual data collection over the life of the 5-year demonstration project should be adequate to establish definitive time series trends for selenium in the groundwater at the site.
Table 53. Preliminary analysis of Selenium trends in groundwater at the Tranquillity site.
|
Well |
Preliminary trend |
Correlation coefficient (r2) |
Significance at 95% confidence |
|---|---|---|---|
|
15M1 |
Downward |
.57 |
Not significant |
|
15P1 |
Upward |
.08 |
Not significant |
|
15M3 |
Downward |
.02 |
Not significant |
|
15B3 |
Upward |
.39 |
Not significant |
|
16J1 |
Upward |
.86 |
Significant |
|
15F1 |
Upward |
.01 |
Not significant |
|
16Q1 |
Upward |
.71 |
Significant |
|
16G1 |
Upward |
.47 |
Not significant |
|
16A1 |
Downward |
.29 |
Not significant |
|
16B1 |
Upward |
.21 |
Not significant |
|
10M1 |
Downward |
.40 |
Not significant |
f. Boron in Groundwater-Tranquillity Site
The presence of high concentrations of boron in the shallow groundwater are of concern due to potential toxicity to plants and wildlife. Boron concentrations in the shallow groundwater at the site are extremely high. The boron concentrations measured in the shallow wells range from 10 to 81 mg/l, with a median value of 45.5 mg/l (Table 51). No water-quality criteria for boron exist for aquatic life or human health. There is an irrigation water criterion of 750 micrograms/liter (µg/l) of boron sensitive crops (US EPA 1986). Perry et al. (1994) have proposed a toxicity threshold in water for crops and aquatic plants of 10 mg/l. Deverel and Millard (1988) noted that boron is geochemically mobile and present as oxyanions in oxidized, alkaline environments such as the western San Joaquin Valley shallow groundwater. The authors also reported high correlation between log transformed boron and specific conductance data for shallow groundwater in the western San Joaquin Valley. Boron concentrations observed in the deep wells at the site are an order of magnitude lower than those in the shallow wells. Boron concentrations measured in the deep wells during year 1 of monitoring range from 2.5 to 8.3 mg/l, with a median concentration of 3.2 mg/l (Table 52). The large difference in boron concentration between the shallow and deep groundwater at the site may be due to adsorption onto soil surfaces or differing geochemical conditions between the shallow and deep groundwater systems. Adsorption of boron on soil particles can affect and limit its solubility (Keren and Bingham 1985). Fujii and Swain (1995) concluded that the relatively conservative behavior of boron observed in shallow groundwater in the San Joaquin Valley probably reflects the presence of high concentrations of competing constituents for adsorption sites.
g. Origin and Isotopic Composition of Groundwater - Tranquillity Site
Groundwater samples were analyzed for tritium and stable isotope ratios of oxygen and hydrogen during the first 3 years of monitoring. Tritium and stable isotope data are currently available for the first 2 years of monitoring. A summary of the tritium data is presented in Tables 39 and 40. The oxygen and hydrogen isotope data can provide insight into the evaporation history of the water, while the tritium data can be used to develop an understanding of the age and origin of the groundwater at the site.
h. Groundwater Age - Tranquillity Site
The levels of tritium, a radioactive isotope of hydrogen with a half-life of 12.43 years, rose in the environment during the 1950's and 1960's because of atmospheric detonation of nuclear weapons. Tritium concentrations can be used to develop an understanding of the origin and history of water samples. Tritium concentrations in water samples are reported in tritium units (TU). Prior to 1952, precipitation contained < 5 TU. Due to radioactive decay, groundwater derived from precipitation before 1952 now has < 0.5 TU. Groundwater derived from precipitation recharged since 1952, including canal water used as irrigation since 1968, commonly has a tritium concentration exceeding 10 TU. Groundwater with a tritium concentration of < 1.6 TU either has recharged prior to 1952 or may have originated as post-1952 irrigation water from deep wells. This large contrast in tritium concentration allows comparison of older groundwater, much of which was recharged prior to agricultural development, to young water recharged since 1952 and derived from irrigation (Dubrovsky et al. 1993).
The tritium data from the shallow wells indicate that the shallow, perched groundwater consist of a mixture of water recharged before and after 1952. Tritium concentrations of the shallow groundwater samples range from 0 to 6 Tritium Units (TU), with a median concentration of 2.4 TU. Low tritium concentrations (< 1 TU) observed in wells 16Q1 and 16F1 may indicate recharge from irrigation water that was pumped from deep production wells completed in the sub-Corcoran aquifer. The tritium data from the deep wells (Well 15M3 and 16B3) completed in coastal range deposits indicate that the groundwater was recharged before 1952. Tritium concentrations observed in these two wells ranged from 0 to 0.5 TU, with a median concentration of 0.1 TU. The tritium data from the deep wells completed in Sierra Nevada sediments indicate that the groundwater has been recharged since 1952. Tritium concentrations found in wells 15C3 and 10G3 range from 9.6 to 14.0 TU, with a median concentration of 10.5 TU.
i. Evaporative concentration of shallowgroundwater-Tranquillity Site
In areas where the water-table is shallow in the western San Joaquin Valley, particularly at depths less than 1.5 meters below land surface, evaporative concentration of dissolved solids in groundwater can increase salinity and selenium concentrations far above the levels resulting from leaching of soil salts by irrigation (Deverell and Fujii 1988). Under irrigated conditions loss of water by evapotranspiration tends to concentrate salts in groundwater rather than soil because the salts are regularly flushed downward by percolating irrigation water and net groundwater movement is generally downward (Dubrovsky et al. 1993).
Hydrogen and oxygen isotope data from shallow groundwater samples at the Tranquillity site show that groundwater salinity is primarily a result of evaporation and evapotranspiration of the shallow groundwater. The evaporation process adds kinetic separation to the hydrogen-2 (deuterium) and oxygen-18 species causing increased enrichment in the O -18 species (Gat and Gonfiantini 1981). This results in a plot of the delta deuterium (D) verses delta O -18 that has a smaller slope than the meteoric water line. The comparison of delta D and delta O -18 shown in Figure 48 illustrates the evaporation that has taken place in the shallow groundwater at the site. Similar evaporative trend lines have been reported by Deverell and Fujii (1988) and Presser and Barnes (1984) for shallow groundwater in the western San Joaquin Valley.
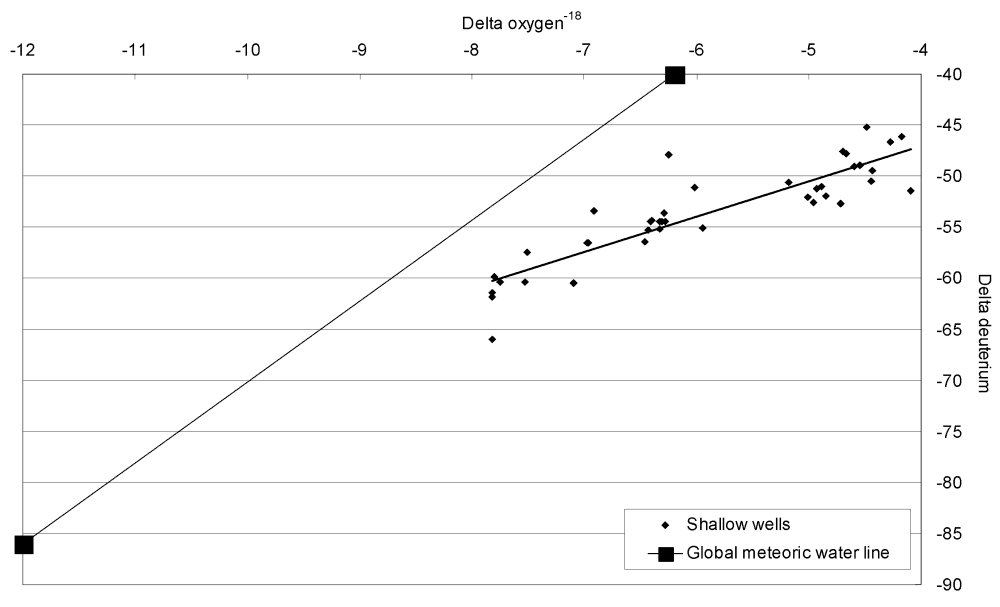
Figure 48.
Plot of stable isotope data for groundwater samples from the
Tranquillity site indicating the shallow groundwater has
undergone significant evaporation.
B. Atwell Island Site
1. Atwell Island Site Geology
The Atwell Island demonstration site lies on the southwestern margin of the Tulare Lake Bed, which is the dominant geologic feature in the study area. The site is underlain by lakebed and marsh deposits consisting primarily of clay and silt with some sand with a thickness in excess of 3,600 ft (Page 1986). The Corcoran Clay member of the Tulare Formation is a regionally extensive fine-grained lakebed deposit that underlies the Atwell Island site at a depth of approximately 900 ft below the land surface. A relict sand dune deposit consisting of fine-grained wind blown sand from the former shoreline of the Tulare lakebed traverses the western boundary of the site from southwest to northeast.
2. Atwell Island Site Soils
Soils in the Atwell Island study area consist of silt and sand loams that are formed in alluvium derived from igneous and sedimentary rocks. Individual soil mapping units found in the study area in the order of abundance include the Posochanet silt loam, Nahrumb silt loam, the Westcamp silt loam, Excelsior find sandy loam, and Lethent fine sandy loam (Figure 49). The Posochanet soils occur primarily in the central portion of the site and cover about 30% of the total study area. These soils are saline, alkaline, very deep, moderately well drained with slow permeability. Salinity ranges from 4 to 8 dS/m in the upper portion and 4 to 30 dS/m in the lower portion. Surface runoff is generally slow, with a low hazard of water erosion. Nahrumb silt loam occurs on basin rims and consists of mixed alluvium from granitic rocks. Nahrumb soils cover about 30% of the total surface area in the southeast part of the site. These soils are very deep, somewhat poorly drained, with very slow permeability. Salinity ranges from 1-16 dS/m in the upper part to 8-30 dS/m in the lower part. Surface runoff is very slow with low surface erosion hazard. Westcamp silt loam soils cover the northwest corner of the study area. The Westcamp soils are saline, alkaline soils that have a perched water table. These soils are very deep, somewhat poorly drained, with very slow permeability. A transient high water table occurs at a depth of 4-6 ft. Salinity ranges from about 2-16 dS/m. Excelsior fine sandy loam soils are found on the sand ridge that traverses the site from northeast to southwest. The sand ridge covers about 15% of the total study area. The Excelsior soils are very deep, somewhat excessively drained alkaline soils. Permeability of the sand ridge soil is moderately rapid, runoff is very slow and hazard of water erosion is slight, however the potential for wind erosion is high under sparsely vegetated conditions. Salinity ranges from 0-8 dS/m in the upper part and 2-16 dS/m in the lower part. The Lethent fine sandy loam occurs in a small area in the southwest part of the study area. This soil is saline, alkaline, very deep, and moderately well drained. Permeability is very slow and the hazard of water erosion is slight.
a. Soil Sampling: Atwell Island Site
Baseline soil sampling will be conducted at the Atwell Island site during spring of 2002. Sixteen sites will be sampled within each experimental block. Each site will be located at the approximate center of the 2-acre plots (Figure 49). Three soil samples will be collected from each site. A 0-12 inch sample consisting of a four increment composite soil samples collected within a 2-meter radius of the central boring. A single soil sample will be collected from the 12-30-inch depth interval. This sample represents the active root zone of irrigated soils. A single soil sample will also be collected from the 30-60-inch substrata zone. This zone represents the lower root zone just above the vadose zone. All soil material will be sampled in the 12-30 and 30-60-inch samples. Sampling in this manner will result in 48 soil samples collected on each 160 acre block. Two field replicate (QC) samples will be collected from each quarter section. Field replicate samples will be done using the fractional shoveling method. All sample sites will be located and georeferenced using a GPS receiver set on the North American 1927 datum.
Soil samples will be analyzed for total and water soluble selenium, sulfate, chloride, electrical conductivity, and moisture. All surface soil samples will be analyzed for boron, magnesium, potassium, sodium, carbonate, and nitrate. The Quality Assurance Project Plan (QAPP) for the Land Retirement Demonstration Project describes in detail the analytical procedures and quality assurance measures taken to ensure soil data quality (CH2M Hill 1999). The soils analyses will be performed by the U.S. Geological Survey and the Bureau of Reclamation analytical laboratories in Denver, Colorado.
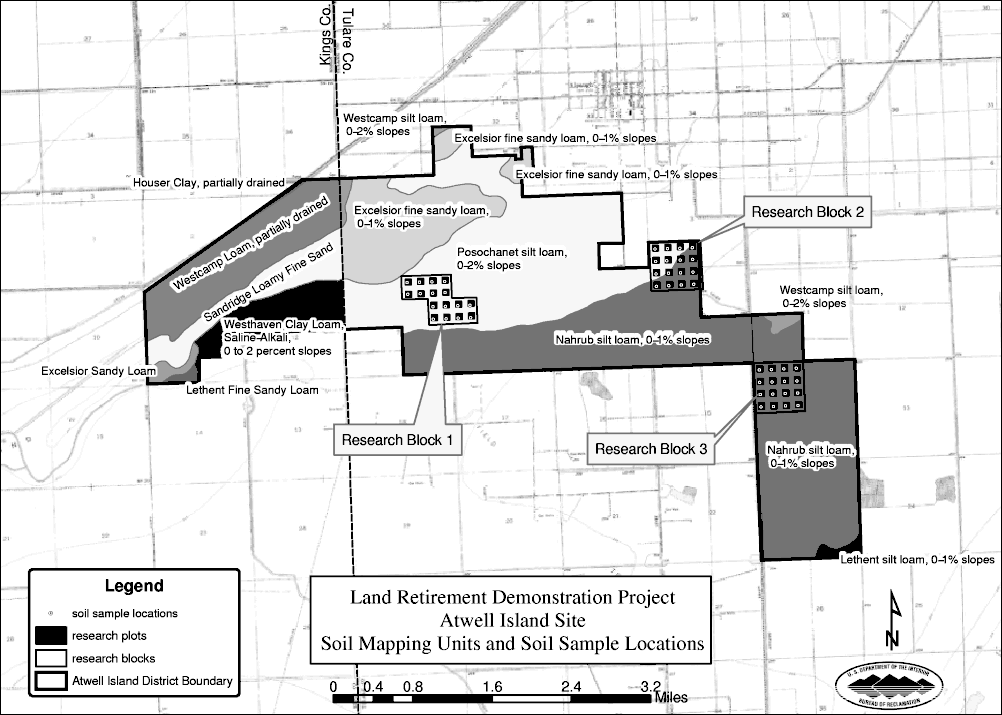
Figure 49.
U.S. Department of Agriculture soil mapping units and soil
sample locations at the Atwell Island site.
3. Weather: Atwell Island Site
Hourly precipitation, temperature, wind and relative humidity data are collected at the California Irrigation Management Information System (CIMIS) weather station #21, which is located approximately 18 miles west of the demonstration project site. The CIMIS station is operated and maintained by the CDWR, and can be used to guide crop irrigation scheduling and estimate consumptive water use for various crops. A total of 7.99 inches of rainfall was recorded at the CIMIS station, with most of the rainfall occurring between January, April, and October-December.
4. Irrigation: Atwell Island Site
A cover crop of barley was planted on the three habitat restoration study blocks at the Atwell Island site to provide weed and dust control and to equilibrate the soil conditions on the study plots prior to installation of the experimental treatments. Accordingly, both the buffer areas and the study plots were planted in barley. Approximately 164 acre-feet of water was applied to 480 acres, resulting in an application rate of approximately 4.1 inches of water per acre. However, water was not applied in equal amounts to each study block. On block 1 (see Figure 49), 64.7 acre-feet of water was applied by flood irrigation during the time period from 24-31 March 2001. On block 2, 48.8 acre-feet was applied by sprinkler irrigation during the time period from 30 March through 5 April, 2001 and on block 3, 50.7 acre-feet of water was applied using sprinkler irrigation.
The largest volume of irrigation water applied at the site during calendar year 2001 was from ongoing farming operations. Farming operations continued on approximately 2,800 acres of the Atwell Island site as negotiations for land acquisition with the current landowners proceeded. Irrigation applications on these lands are currently scheduled based on a calendar or rotational approach. Metered pumping volumes for applied irrigation water are not available from the current landowners. Typical irrigation applications consist of gravity flow (flood irrigation) of about 6 acre-inches per acre. An estimate of applied water and deep percolation (groundwater recharge) for irrigated lands within the demonstration project boundary at the Atwell Island site is shown in Table 54 (Smith 2001).
Table 54. Estimated 2001 net crop water requirement and deep percolation losses at the Atwell Island site.
|
Crop |
Acreage |
Total crop water requirement
|
Irrigation water application requirement
|
Estimated deep percolation
|
|---|---|---|---|---|
|
Alfalfa |
1,142 |
4,568 |
7,028 |
2,460 |
|
Barley |
160 |
211 |
325 |
114 |
|
Oats |
1,001 |
821 |
1,263 |
442 |
|
Safflower |
490 |
1,269 |
1,952 |
683 |
|
Total |
2,793 |
6,869 |
10,568 |
3,699 |
5. Hydrology and Surface Water Monitoring: Atwell Island Site
Monitoring of surface water at the Atwell Island site will commence in calendar year 2002. The natural drainage in the study area is to the north-northwest with ground surface elevations ranging from about 205 ft AMSL, in the southeast portion of the site to about 215 ft AMSL in the northeastern portion of the site. A pronounced sand ridge traverses the northern boundary of the site in a northeasterly direction. The sand ridge was formed from windblown sand deposited along the southern shore of the Tulare Lake bed. Surface water courses within the study area consist primarily of irrigation supply canals and irrigation return flow ditches, although the site has an artificially constructed 20-acre wetland that is filled from surface irrigation water supplies. Shallow ephemeral surface water ponds may form on low lying portions of the site due to localized sheet flow run-off during prolonged winter storm events. The surrounding areas in the vicinity of the Atwell Island site receive periodic unregulated winter storm flows from Deer Creek, Poso Creek, and the White River. The study area parcels under consideration are generally not subject to long term flooding due to their higher topographic position with respect to the adjacent lower lying lands.
6. Groundwater Level Monitoring: Atwell Island Site
There are approximately 20 monitor wells in the project vicinity that will be used to measure groundwater levels beneath the site on a quarterly basis. The well locations are shown on Figure 50 . Existing wells constructed prior to the purchase of the demonstration project lands were installed by the U.S. Geological Survey, the CDWR and the USBR to assess groundwater conditions in the Tulare basin. These existing wells are constructed of PVC casing ranging in diameter from 0.75 to 3 inches and vary in depth from 20 to 190 ft below the ground surface. These wells were installed using various construction techniques that range from jetting a short length of pipe into the ground to standard rotary drilling with hydraulic drill rigs. During the fall of 1999, the USBR installed 17 new monitoring wells for the purpose of measuring groundwater levels and obtaining representative groundwater samples for water quality analyses for the Land Retirement Demonstration Project. The new wells range in depth from 15 to 60 ft below land surface and were installed using a hollow stem auger drill rig and are constructed of 2 inch PVC casing. Well construction diagrams for the new wells are on file in the USBR offices in Fresno and Sacramento. Well construction information for the USGS wells are published by Beard et al. (1994), Fujii and Swain (1995) and Swain and Duell (1993).
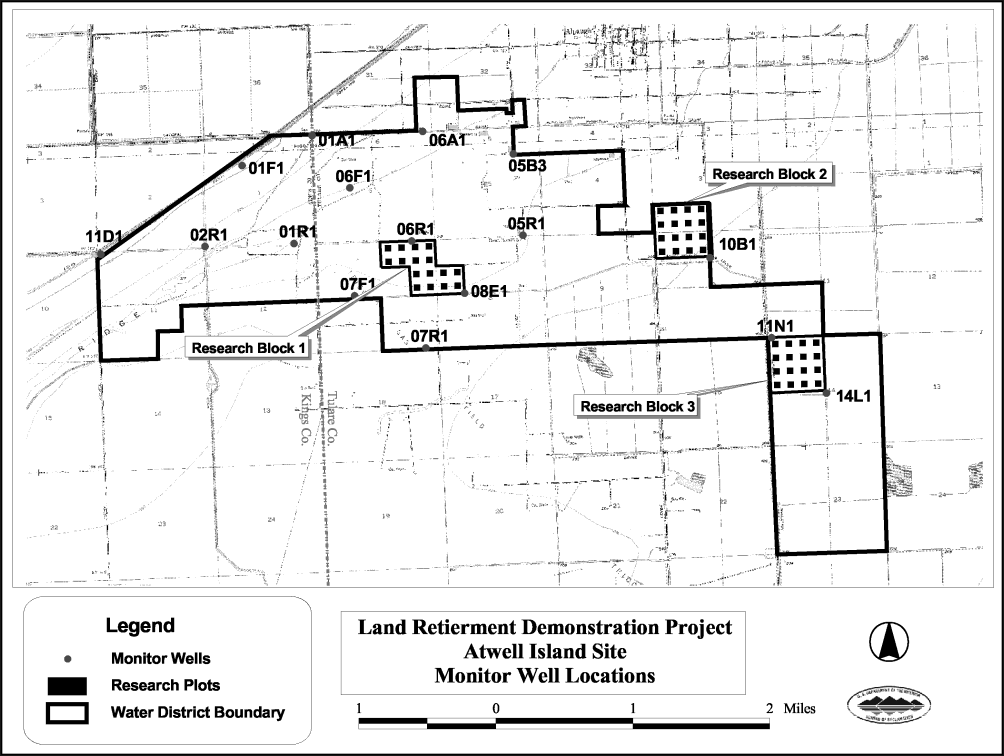
Figure 50.
Monitor well locations at the Atwell Island site.
7. Groundwater Levels: Atwell Island Site
Calendar year 2002 will serve as the baseline year for establishing groundwater levels and groundwater quality at the Atwell Island site. Groundwater levels measured in 20 wells during January 2002 confirm the presence of shallow, perched water table conditions at the Atwell Island site. Groundwater levels observed during January 2002 in the shallow groundwater system range from 4.3 to 14.8 ft below land surface. In general, the water-table is highest (nearest the land surface) in the northeast corner of the site and becomes deeper in the southeast portion of the site. These observations are consistent with those of Beard et al. (1994) and the USBR (1982). Water levels will be measured quarterly in the monitor wells over the life of the demonstration project in order to track the water-table response to land retirement. An attempt will be made to identify and collect water level data from appropriate reference wells in the project vicinity.
8. Groundwater Quality Monitoring: Atwell Island Site
Baseline groundwater quality samples will be taken on a quarterly basis during the first year of monitoring at the Atwell Island site. The first round of groundwater samples were taken from 20 wells at the Atwell Island site in January 2002. The same sampling and analysis protocols that were used at the Tranquillity site will be used on groundwater samples at the Atwell Island site.