Endangered Species Recovery Program | |
|
Home | News | Publications | Species profiles | Data and maps | About | Staff | Links | Department of Biological Sciences | CSU Stanislaus |
III. SITE-WIDE ACTIVITIES
This section describes the restoration research, biological monitoring, and management actions that have been conducted during 2001 on the Tranquillity and Atwell Island study sites. Included are results and updates from restoration trials that were implemented in past years and descriptions of trials that were implemented in 2001.
A. Tranquillity
1. Restoration Studies
Locations of the various restoration study areas at the Tranquillity site are presented in Figure 23.
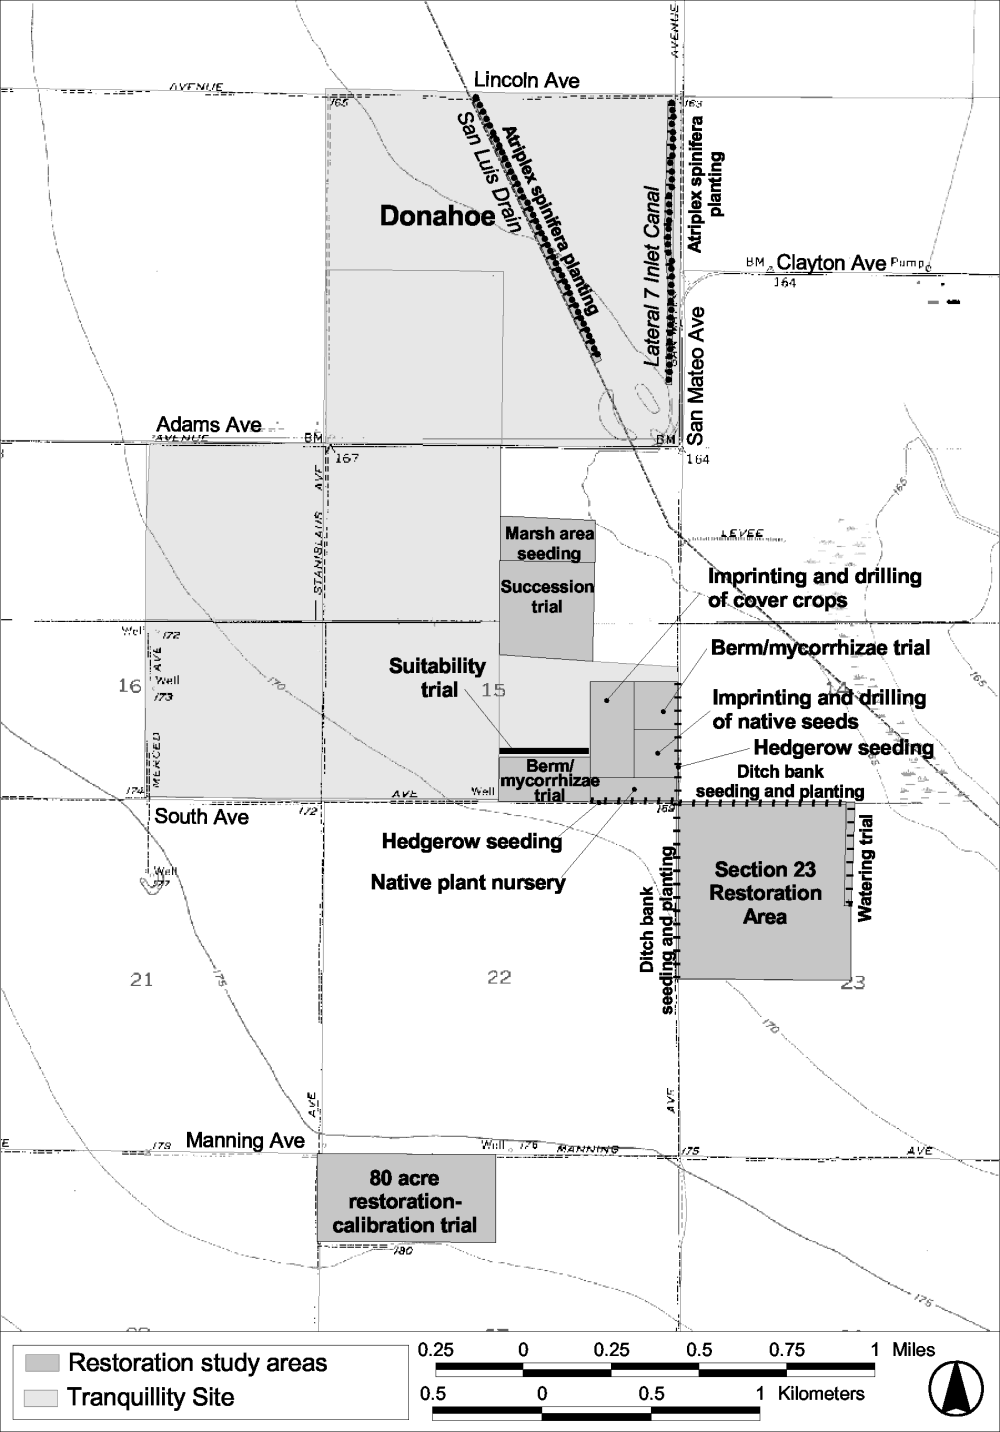
Figure 23.
Locations of the various restoration study areas at the
Tranquillity site.
a. Imprinting vs. Drilling of Native Seeds
In this and the following trial (imprinting vs. drilling of cover crops), methods to introduce native seeds without the expensive ground preparation often required with traditional seed drills were explored. Tillage brings weed seed to the soil surface and breaks down soil structure. Hence, it was anticipated that less soil disturbance would decrease weed density and promote the establishment of mycorrhizal networks in the soil, both of which tend to favor native plants (St. John 1995).
i. Methods
The performance of two seeding techniques, imprinting and drilling, was investigated (see Uptain et al., 2000 for a detailed description of these techniques). Installation of the experiment was undertaken in the fall of 2000. Six experimental plots approximately 1.5 acre in size were installed; three plots were imprinted and three were drilled with native seed (Figure 24). The seed mixture contained seeds of nine native species (Table 22). Vegetation sampling was conducted the following spring (May 15, 2001). Vegetation sampling was accomplished by taking eight samples (35 x 70 cm) per plot. Estimates of plant species cover and composition were obtained by the methodology described for the permanent study plots.
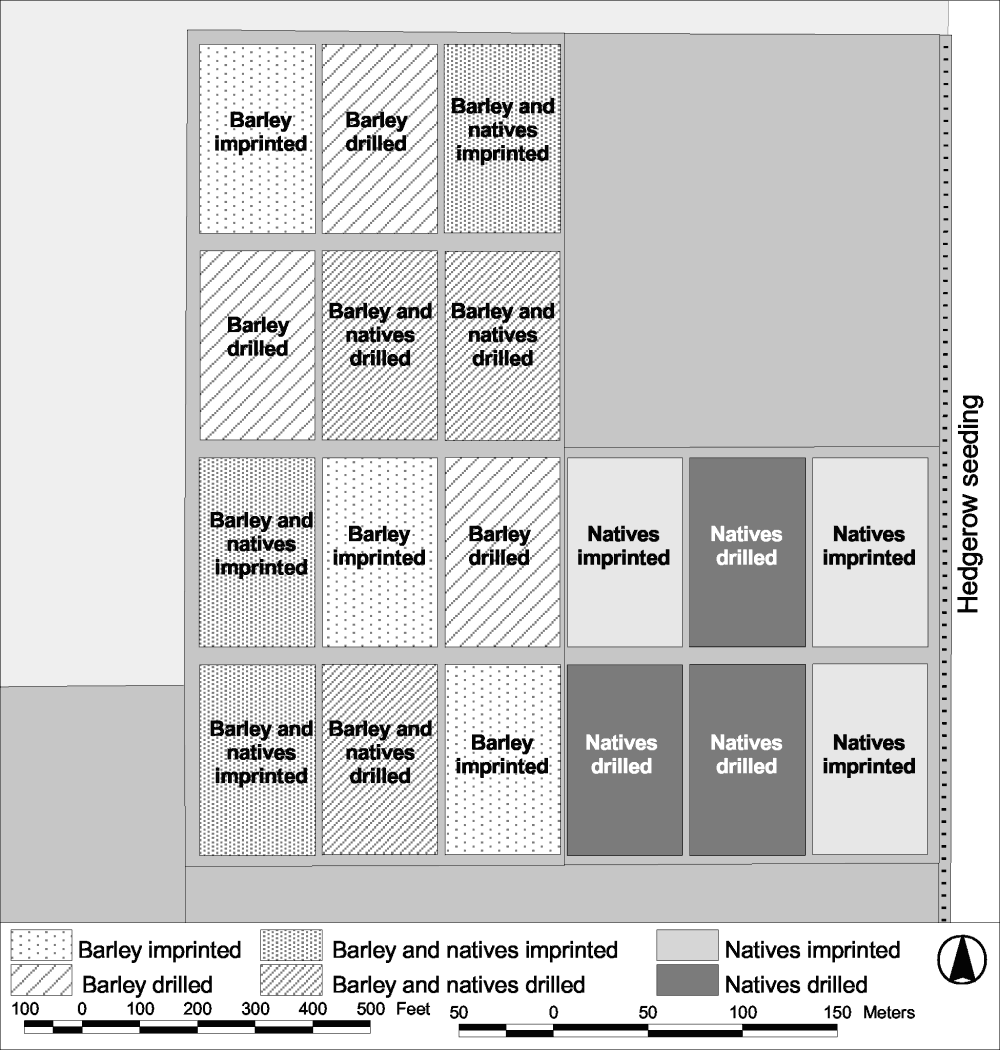
Figure 24.
Location of the Imprinting vs. drilling of native seed trial,
and the Imprinting vs. drilling of cover crops trial.
ii. Results
Five of the nine species included in the seed mix were encountered during sampling; all five were present in both the imprinted and drilled plots (Table 22). Lasthenia californica was the most abundant imprinted species (Figure 25 A); however, this species was much less successfully established through drilling (Figure 25 B). In general, the abundance of the remaining successfully seeded species (i.e., those that were encountered during sampling) varied little between seeding techniques (Table 22; Figure 25). An exception was Amsinckia menziesii , which appeared to be more successfully established by drilling than by imprinting.
Table 22. Overview of species encountered in imprinting vs. drilling of native seed. Species marked with an asterisk are those used in the seed mix. Species with no percent cover are those that were included in the seed mix but which were not encountered during sampling. Note: species are listed in descending order of performance in both trials (i.e., the sum of total mean percent covers from both the imprinted and drilled treatments).
|
Scientific name |
Taxon code 1 |
Origin |
Imprinted 2 |
Drilled 3 |
|---|---|---|---|---|
|
Melilotus indica |
MEIN |
Introduced |
38.42 |
43.56 |
|
Sisymbrium irio |
SIIR |
Introduced |
26.69 |
27.83 |
|
Lasthenia californica * |
LACA |
Native |
3.47 |
0.03 |
|
Hordeum murinum |
HOMU |
Introduced |
1.69 |
0.56 |
|
Hordeum depressum * |
HODE |
Native |
1.42 |
0.53 |
|
Capsella bursa-pastoris |
CABU |
Introduced |
0.97 |
0.97 |
|
Vulpia microstachys * |
VUMI |
Native |
1.03 |
0.61 |
|
Atriplex argentea |
ATAR |
Native |
0.44 |
0.36 |
|
Amsinckia menziesii * |
AMME |
Native |
0.08 |
0.58 |
|
Leymus triticoides * |
LETR |
Native |
0.19 |
0.44 |
|
Phalaris sp. |
PHSP |
Not known |
0.42 |
---- |
|
Hordeum vulgare |
HOVU |
Introduced |
---- |
0.17 |
|
Bromus madritensis |
BRMA |
Introduced |
---- |
0.17 |
|
Salsola tragus |
SATR |
Introduced |
0.17 |
---- |
|
Atriplex sp. |
ATSP |
Not known |
---- |
0.03 |
|
Atriplex polycarpa * |
---- |
Native |
---- |
---- |
|
Isocoma acradenia * |
---- |
Native |
---- |
---- |
|
Sporobolus airoides * |
---- |
Native |
---- |
---- |
|
Suaeda moquinii * |
---- |
Native |
---- |
---- |
|
||||
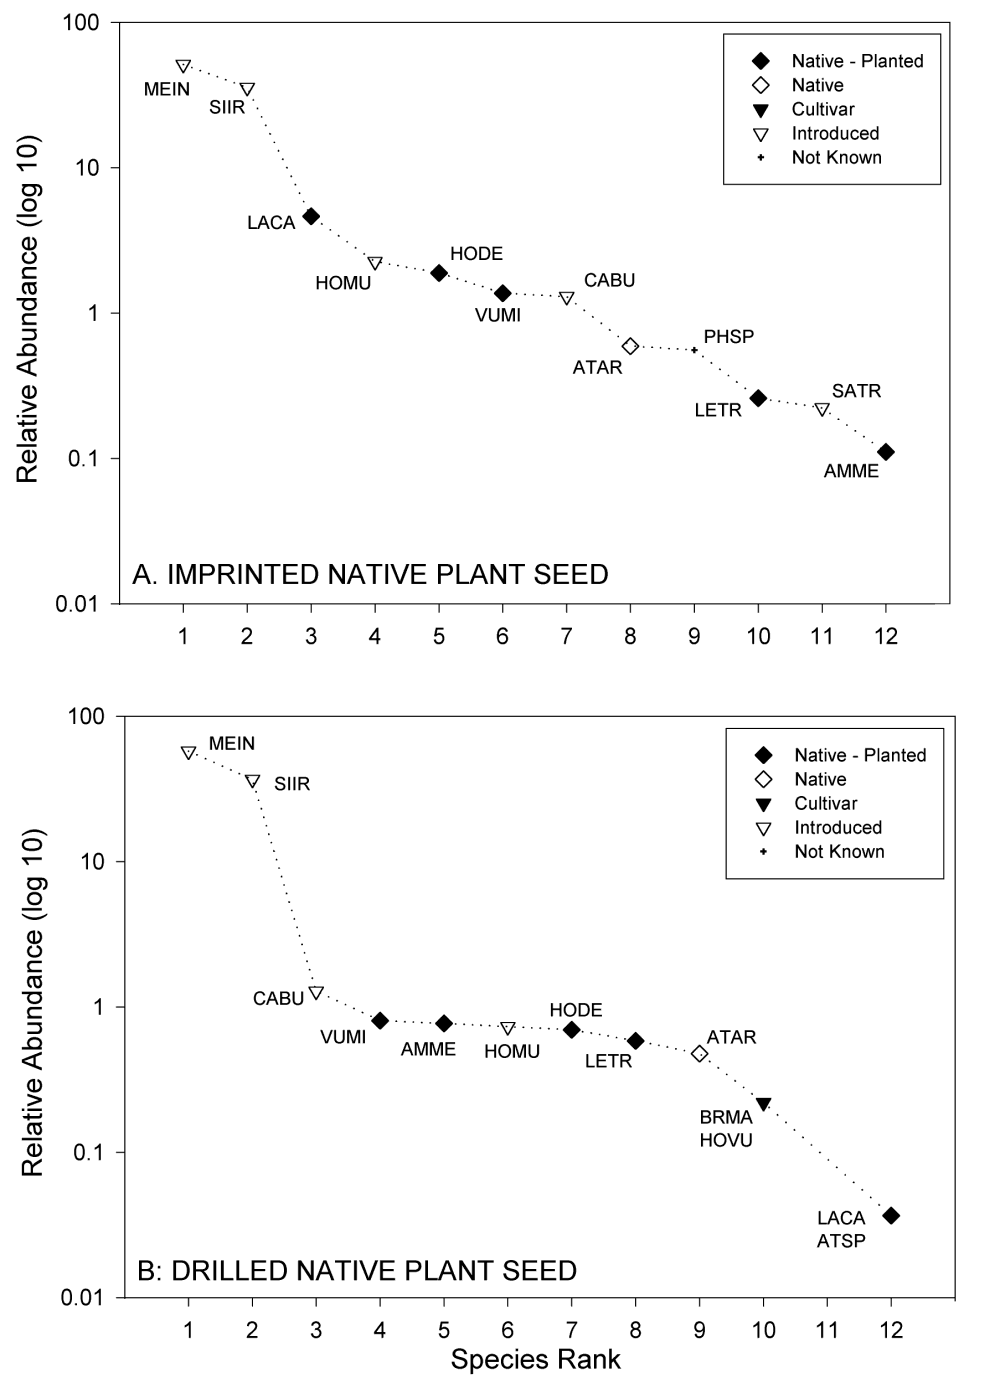
Figure 25.
Rank-abundance of species encountered in the imprinted plots
(A) and drilled plots (B). A key to species is provided in
Table 22.
In order to compare the results statistically, the data were arcsine transformed and a t -test conducted. The difference between the two treatments was not found to be statistically significant when considering all seeded species; the sole species in which there was a significant difference between treatments was Lasthenia californica ( p = 0.0167).
The mean percent cover of the target species seeded by imprinting was nearly three times the value for drilling (Table 23). Nevertheless, non-planted species were by far the most abundant component of the vegetation (Figure 25). The dominance of "non-planted species" is clear when the data is tabulated by species "class" (Table 23); for both treatments, the mean percent cover contributed by introduced species was more than an order of magnitude greater than that of the seeded species.
Table 23. Summary of species encountered in imprinting vs. drilling of native seed trial.
|
Species class |
Imprinted 1 |
Drilled 2 |
|---|---|---|
|
Planted |
6.194 |
2.194 |
|
Not planted |
68.389 |
73.444 |
|
Not known* |
0.417 |
0.028 |
|
||
iii. Discussion
Of particular note were the different results obtained by imprinting and drilling Lasthenia californica . This species has been one of the more successful in the restoration mix and the difference between the two techniques suggests that it would be inefficient to attempt to establish this species by range-drilling. In contrast, Amsinckia menziesii appeared to be more successfully introduced when drilled; but the results were not statistically significant. Nevertheless, A. menziesii is now being considered for inclusion in future restoration efforts. We need to decide if this species should be seeded by some method other than imprinting (e.g., broadcasting following the imprinting of the other species).
Three of the species that were included in the seed mix, but which weren't encountered during sampling- Atriplex polycarpa , Isocoma acradenia , and Sporobolus airoides -also had fairly limited success in the permanent plots. Their seeming inability to become established through either of the seeding methods used here suggests that their inclusion in the seed mixes for future restoration efforts may not be appropriate. These species might still be successfully introduced into restored lands by broadcasting or as transplanted seedlings. These species might also demonstrate better success when drilled or imprinted on different soil types. Additionally, it may well be that their success will be limited to years with additional rainfall or with a different temporal distribution of rainfall.
Of overriding importance is the very low percent cover of the seeded species relative to non-planted species (Table 23). It seems likely, given the conditions at the Tranquillity site, that neither imprinting nor drilling will be sufficient to assure the establishment of native vegetation without some form of weed control.
b. Imprinting vs. Drilling of Cover Crops
It may often be necessary to accomplish large-scale restoration in phases. Cover crops will most likely be an important restoration tool in these situations, particularly if they can be planted with minimum ground preparation (see Uptain et al. 2000 for an elaboration of the potential benefits associated with cover cropping).
i. Methods
As in the preceding trial, the performance of two seeding techniques, imprinting and drilling was investigated. Comparisons were investigated using two seeding regimes: 1) a barley monoculture; and, 2) barley mixed with three native grasses ( Bromus carinatus, Leymus triticoides, Vulpia microstachys ). Installation of the experiment was undertaken in the fall of 2000. Three replicates of each treatment were installed on 12 experimental plots, each approximately 1.5 acre in size (Figure 24). Vegetation sampling was conducted the following spring (14-15 May 2001). Eight samples (35 x 70 cm) per plot were taken. Estimates of species cover and composition were obtained using the methodology described for the permanent study plots.
ii. Results
Barley
Barley was by far the most abundant species in both the imprinted and drilled treatments (Table 24). Although a few non-seeded species were present in the study plots, these contributed little to the overall vegetative cover (Table 24; Table 25; Figure 26 A and B). All non-seeded species encountered in the plots were non-natives (Table 24). Barley was not established better by imprinting than by drilling (Table 25).
Based on the tabulated data, it appeared that barley was more successfully established by imprinting than by drilling (Table 25). However, in a t -test of the arcsine transformed data the difference between the two treatments was not found to be statistically significant ( t = 1.051 ; p= 0.3522).
Barley and native species
Barley was by far the most abundant species in both the imprinted and drilled treatments (Table 24). Of the remaining three seeded species, two were encountered in both the imprinted and drilled plots, while the fourth ( Bromus carinatus ) was not recorder for either seeding method (Table 24). More non-seeded species (seven, Table 24) were encountered in this trial than were encountered in the preceding trial (i.e., imprinting vs. drilling of barley). Non-seeded species were of both native and non-native origin (as well as two species of unknown origin). Non-seeded species comprised a greater percentage of total vegetation cover than in the preceding trial (Table 25; Figure 26 C and D). Drilling yielded a somewhat greater mean percent cover of seeded species than did imprinting (Table 25). Nevertheless, a t -test of the arcsine transformed data indicated that differences between the treatments were not significant ( t = 1.052; p = 0.35). Likewise, no significant differences between treatments were found for any individual species.
From an examination of the data compiled by species "class" (i.e., cover crop vs. non-planted species), it appeared that seeding barley alone was more effective at excluding introduced species than was the mixture of barley and native grass species (Table 25). A t -test of the arcsine transformed data indicated that this perceived difference was not statistically significant ( t = -4.07544; p = 0.002). However, it is suspected some of the difference between the treatments was due to weedy species may have been introduced with the native grass seed.
Table 24. Overview of species encountered in imprinting vs. drilling of cover crops. Species marked with an asterisk are those used in the seed mix. Species with no percent cover are those that were included in the seed mix but which were not encountered during sampling. Note: species are listed in descending order of total mean percent cover (i.e., the sum of all treatments).
|
Species |
Origin |
Barley Imprinted 1 |
Barley Drilled 2 |
Barley and natives Imprinted 1 |
Barley and natives Drilled 2 |
|---|---|---|---|---|---|
|
Hordeum vulgare * |
Cultivar |
67.78 |
55.83 |
49.58 |
51.67 |
|
Melilotus indica |
Introduced |
2.39 |
1.42 |
8.92 |
3.42 |
|
Sisymbrium irio |
Introduced |
1.19 |
0.08 |
1.22 |
1.19 |
|
Vulpia microstachys * |
Native |
-- |
-- |
1.03 |
1.25 |
|
Leymus triticoides * |
Native |
-- |
-- |
0.86 |
0.58 |
|
Grass A |
Not known |
-- |
-- |
0.31 |
0.44 |
|
Capsella bursa-pastoris |
Introduced |
-- |
0.22 |
0.33 |
0.19 |
|
Grass B |
Not known |
-- |
-- |
0.06 |
0.19 |
|
Avena fatua |
Introduced |
-- |
-- |
0.03 |
0.17 |
|
Brassica nigra |
Introduced |
-- |
-- |
0.17 |
0.00 |
|
Hordeum murinum |
Introduced |
0.06 |
-- |
0.06 |
0.03 |
|
Atriplex argentea |
Native |
-- |
-- |
-- |
0.06 |
|
Amsinckia menziesii |
Native |
-- |
-- |
0.03 |
-- |
|
Phalaris sp. |
Not known |
-- |
-- |
-- |
0.03 |
|
Bromus carinatus * |
Native |
-- |
-- |
-- |
-- |
|
|||||
Table 25. Summary of species classes encountered in imprinting vs. drilling of cover crops.
|
Species class |
Barley Imprinted1 |
Barley Drilled2 |
Barley and natives Imprinted1 |
Barley and natives Drilled2 |
|---|---|---|---|---|
|
Cover crop |
67.78 |
55.83 |
51.47 |
53.50 |
|
Non-planted |
3.64 |
1.72 |
11.11 |
5.72 |
|
||||
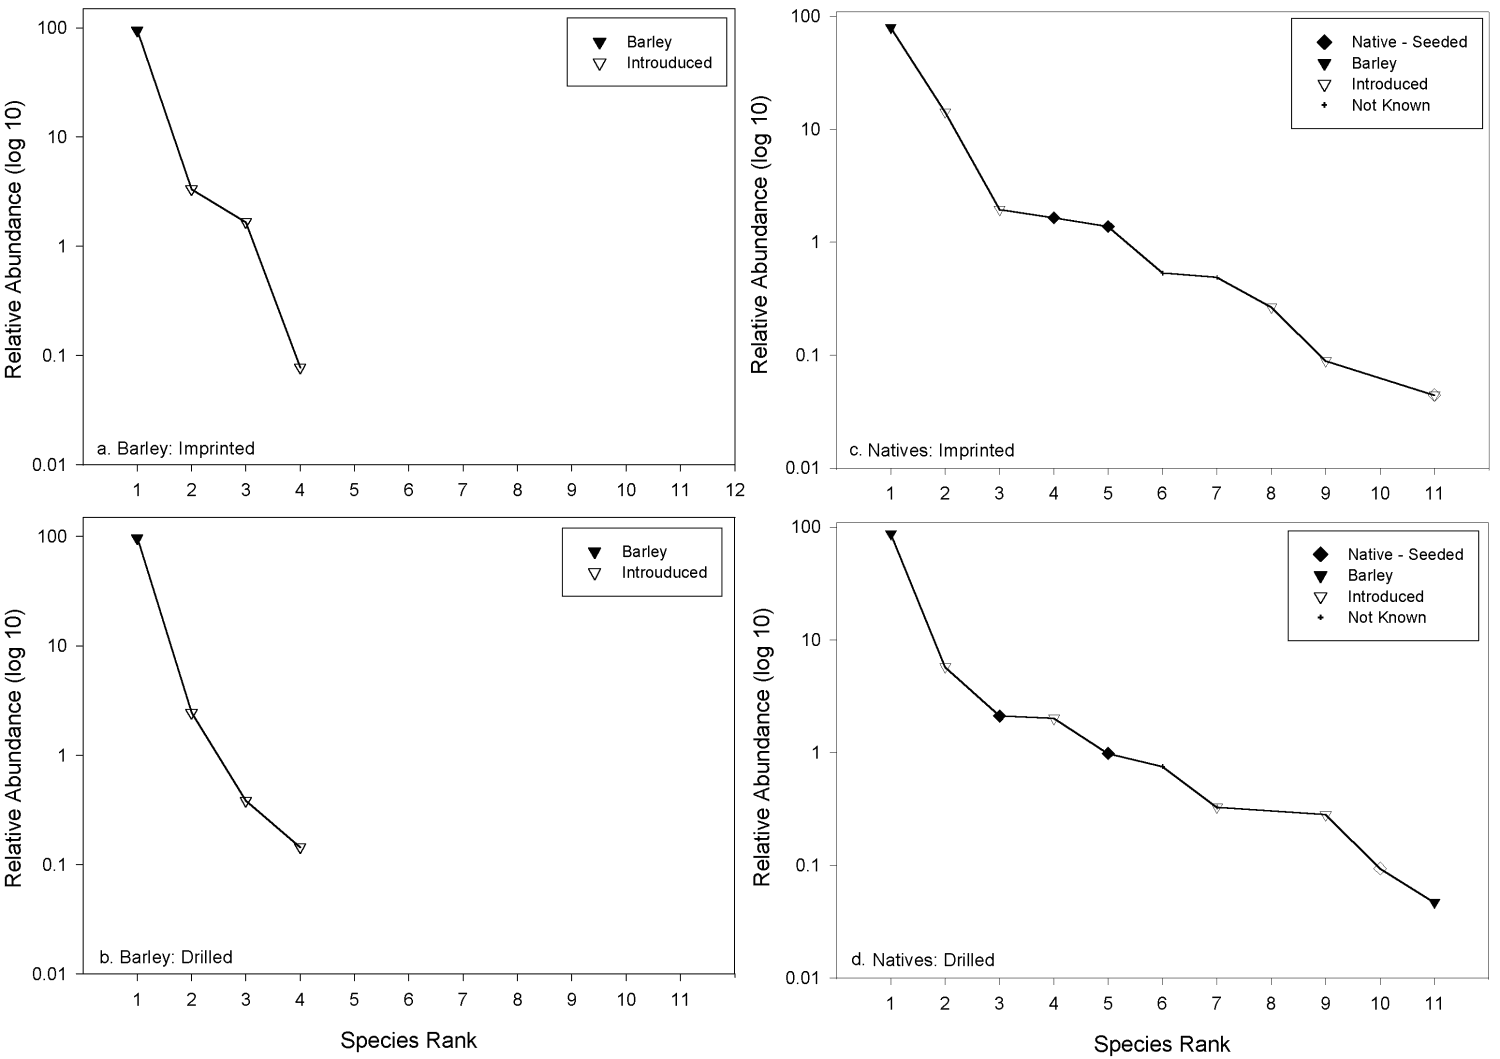
Figure 26.
Rank abundance of species encountered in imprinting and
drilling of cover crops: a and b (barley only), and c and d.
(barley with native grasses).
iii. Discussion
The absence of statistically significant differences between imprinting and drilling of barley suggests that either approach was of approximately equal applicability, at least within the context of the set of conditions at the site.
Of particular interest was the difference in the number of introduced species in the two trials (Table 24). While some of these differences can undoubtedly be ascribed to sampling artifacts, the results suggest that weedy species are being introduced to the site by their inclusion in commercially purchased native seed.
The extremely poor response of Bromus carinatus to both seeding methods is very interesting. This species responded fairly well to imprinting in the Tranquillity HRS plots (i.e., present in about 25% of the quadrats in imprinted plots). However, in this years vegetation sampling it was noted in only two quadrats. This decline in frequency, along with the poor performance of B. carinatus in the seeding trial, may indicate that the dry conditions that were characteristic of 2001 may have been unsuitable for the germination and growth of this species. It should also be noted that as many of the grasses present in the plots were too young to be confidently identified, the performance of some species may have been better than indicated by the data.
c. Section 23 Restoration
i. Methods
The 160 acres at the Tranquillity site comprising the northwest quadrant of Section 23 were restored commencing in December. Seventeen species were imprinted from seed (Table 26, Uptain et al. 2001). Additionally, 5,500 seedlings of three species ( Allenrolfea occidentalis , Atriplex polycarpa , and Sporobolus airoides ) were planted at the site.
Vegetation sampling was undertaken in May, 2001. The 160-acre area was divided into two halves, with 24 vegetation samples (35 cm by 70 cm rectangular quadrats) taken from each area. All species were noted, and the percent cover was estimated for each species using a modified Daubenmire cover scale (Bonham 1989). Total percent cover of all species within the quadrat was estimated using the same cover scale. Whenever possible, species were identified completely; failing this, species were assigned morpho-species names.
ii. Results
Eighteen taxa were encountered during vegetation sampling (Table 26). Of these, seven were native, seven were clearly introduced, one (barley) was a non-native species that had been planted the year before, and three species could not be definitely assigned as to origin (Table 26). Of the seven native species, five had been imprinted; thus, of the seventeen species imprinted in the restoration area, only about one quarter (29.1%) were noted during vegetation sampling.
Table 26. Overview of species encountered during vegetation sampling of the 160-acre restoration area for 2001 (Section 23, Tranquillity site). Species marked with an asterisk are those used in the seed mix.
|
Species |
Common name |
Freq. 1 |
Cover 2 |
Site cover 3 |
Origin 4 |
|---|---|---|---|---|---|
|
Phalaris sp. |
canarygrass |
43 |
10.95 |
9.81 |
N.A. |
|
Brassica nigra |
black mustard |
40 |
20.43 |
17.02 |
I |
|
Avena fatua |
wild oats |
37 |
16.61 |
12.80 |
I |
|
Amsinckia menziesii * |
farmer's fireweed |
25 |
2.98 |
1.55 |
N |
|
Lasthenia californica * |
goldfields |
17 |
1.09 |
0.39 |
N |
|
Beta vulgaris |
common beet |
13 |
12.62 |
3.42 |
I |
|
Hordeum vulgare |
Barley |
11 |
3.41 |
0.78 |
B |
|
Melilotus indica |
sourclover |
11 |
4.73 |
1.08 |
I |
|
Phacelia distans |
common phacelia |
10 |
2.70 |
0.56 |
N |
|
Sisymbrium irio |
London rocket |
6 |
0.50 |
0.06 |
I |
|
Hordeum murinum |
foxtail Barley |
5 |
1.00 |
0.10 |
I |
|
Vulpia microstachys * |
small fescue |
5 |
1.00 |
0.10 |
N |
|
Gilia tricolor * |
bird's eye Gilia |
3 |
1.33 |
0.08 |
N |
|
Atriplex argentea |
silver scale |
2 |
1.75 |
0.07 |
N |
|
Hordeum depressum |
alkali Barley |
2 |
0.50 |
0.02 |
N |
|
Erodium cicutarium |
red-stemmed filaree |
1 |
0.50 |
0.01 |
I |
|
Unknown Atriplex |
saltbush |
1 |
0.50 |
0.01 |
N.A. |
|
Unknown |
N.A. |
1 |
0.50 |
0.01 |
N.A. |
As with the Tranquillity HRS plots, the most frequently encountered species at the 160-acre restoration site were non-imprinted. The most frequently encountered species ( Phalaris sp.; Table 26) was not identifiable to species and, as both native and non-native representatives of the genus are known for California, it was not possible to identify its origin. Still, no species of the genus were included in the restoration mix and the only species of Phalaris noted to date at the Tranquillity site has been P. minor (an introduced species). It seems likely that this was also the species collected during sampling at the 160-acre restoration site. Overall, six species occurred in at least 25% of the sampling quadrats (Table 26); of these, only two - Amsinckia menziesii and Lasthenia californica -were imprinted.
In order to ascertain the relative success of the planted species, the cover data were tabulated by class (i.e., planted, non-planted, etc.). By all measures, non-planted species far exceeded the contribution of imprinted species (Table 27). In order to better consider the contribution of particular species and species classes to the restored vegetation, a rank-abundance curve was plotted from the sampling data (Figure 27). The general predominance of non-imprinted species is clearly evident, as the four most abundant species were either introduced or, in the case of the aforementioned Phalaris sp., of uncertain status. Nevertheless, the gradual slope of the curve suggests relatively high evenness in the first year's vegetation ( sensu Kent and Coker 1992).
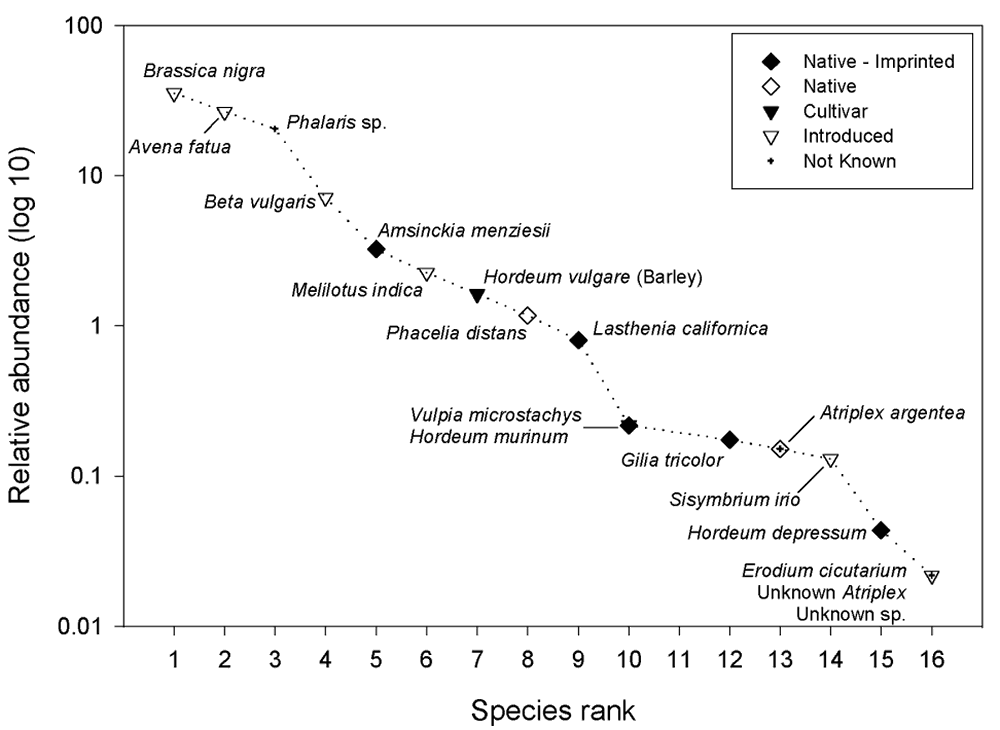
Figure 27.
Rank-abundance of species encountered during vegetation
sampling of the Section 23 restoration.
Table 27. Summary of species classes encountered during vegetation sampling of the Section 23 restoration.
|
Species class |
Freq. 1 |
Cover 2 |
Site cover 3 |
|---|---|---|---|
|
Planted |
50 |
6.40 |
2.13 |
|
Non-planted |
127 |
61.33 |
35.16 |
|
Cover Crop |
11 |
3.41 |
0.781 |
|
N.A. |
45 |
11.95 |
9.83 |
|
|||
iii. Discussion
Although many native species were noted in the restored area, introduced taxa were far more abundant (Table 26; Table 27). The preponderance of a number of aggressively weedy species, such as Brassica nigra , Beta vulgaris , Sisymbrium irio , and Atriplex argentea , will make it difficult for native species to gain dominance. The restoration study on this area was compromised when the area was mistakenly grazed by sheep in late September-early October. By the time the sheep were removed from the study site, virtually all the transplanted perennial species that had become established were grazed to ground level. We do not know the effects on the seed bank but anticipate that the grazing will favor the weedy species.
Of the four imprinted species that were noted during sampling, two- Lasthenia californica and Vulpia microstachys -also were present in the seed mix used in establishing the Tranquillity HRS plots. The establishment of both species was fairly successful in the plots during the first year, and their performance in the 160-acre restoration area suggests that their continued inclusion in the restoration mix is warranted. The successful establishment of Amsinckia menziesii (i.e., the fourth most abundant species, Figure 27) from imprinted seed also is noteworthy. A. menziesii appears to be capable of competing against non-native weeds. Its use in future restoration mixes should be considered. Nevertheless, A. menziesii was much more successfully seeded by drilling than by imprinting (see section III A 1 a) and initial indications from the Native Plant Nursery suggest that this species may be successfully established by broadcasting. Hence, it may be optimal to introduce A. menziesii by broadcasting after other species have been imprinted. Also of note was the fairly successful establishment of another native species, Phacelia distans , the eighth most abundant species (Figure 27). Although not included in the seed mix, P. distans is common in some areas adjacent to the Tranquillity site and its use in further restoration activities should be considered.
d. Hedgerow Seeding
Vegetation on field borders may harbor pests, therefore these areas are usually disked or sprayed with herbicide. Hedgerows of native species situated along field borders may be an alternative to disking or herbicide use. Hedgerows may be maintained with minimal management, may tend to favor beneficial insects, and also can provide important habitat for birds and other wildlife (Clark and Rollins 1996).
An approximately 10-foot wide hedgerow situated along the southern and eastern edge of the ancillary trial area (Figure 23) was imprinted with native seeds in December 2000 (Table 28). Berms were constructed along the edges of the hedgerow to allow the area to be flood irrigated. In January 2001, seedlings of Atriplex lentiformis , Leymus triticoides , Nassella pulchra and Sporobolus airoides were planted along the berm adjacent to the hedgerow.
Table 28. Seed mix and application rate for the hedgerow seeding at the Tranquillity site. Seed source information provided by seed vendor.
|
Scientific name |
Common name |
Seed source |
Lbs./acre |
|---|---|---|---|
|
Amsinckia menziesii |
rancher's fireweed |
San Bernardino |
3 |
|
Atriplex lentiformis |
quailbush |
Taft |
3 |
|
Atriplex polycarpa |
valley saltbush |
Fresno County |
5 |
|
Dichelostemma capitatum |
blue dick |
Camp Pendleton |
3 |
|
Eremocarpus setigerus |
doveweed |
Kern County |
3 |
|
Frankenia salina |
alkali heath |
Southern CA |
8 |
|
Helianthus annuus |
sunflower |
Ensenada |
8 |
|
Heliotropium curassavicum |
heliotrope |
Temecula |
3 |
|
Leymus triticoides |
creeping wild rye |
Fresno County |
8 |
|
Sporobolus airoides |
alkali sacaton |
Unknown |
3 |
|
Vulpia microstachys |
Nuttall's fescue |
Fresno County |
8 |
Vegetation monitoring was limited to periodically recording observations throughout the year. Atriplex lentiformis was observed to do well in 2001. Helianthus annuus germinated well in this habitat and set fruit. However, H. annuus is an annual species and it still remains to be seen whether or not it will prove capable of re-seeding itself as disturbance in this area is lessened. Leymus triticoides also grew well in this area. Periodic monitoring will continue in 2002.
e. Marsh Area Seeding
Historically, a seasonal wetland was formed by agricultural runoff from lands adjacent to LRDP lands. This water would often overflow into LRDP property, forming a marshy area on the order of 8 acres. In 2000 this area was imprinted with a native seed mix of 14 species. Regrettably, later in the year this area was inadvertently disked. Although formal sampling could not be conducted, individuals of four of the imprinted species ( Frankenia salina, Lasthenia californica, Heliotropium curassavicum , and Suaeda moquinii ) were observed along the fringes of the disked area. Additionally, some sterile grasses were observed growing in the same area, but these could not be confidently identified.
In January 2002, a 9.6-acre area was re-imprinted using the same seed mix as was used in 2000 (Table 29). Currently, LRDP controls the flow of water to the canal that formerly provided the runoff water, and the marshy area now receives significantly less water than in previous years. Hence, species that naturally occur in both mesic conditions and in upland habitats were selected for the seed mix. To monitor the success of the trial, vegetation sampling will be conducted in spring, 2002.
Table 29. Species seeded in the marsh area at the Tranquillity site, 2002.
|
Scientific name |
Common name |
Lbs./acre |
|---|---|---|
|
Atriplex polycarpa |
valley saltbush |
0.10 |
|
Dichelostemma capitatum |
blue dick |
0.63 |
|
Eleocharis macrostachya |
spikerush |
0.10 |
|
Frankenia salina |
alkali heath |
0.31 |
|
Heliotropium curassavicum |
heliotrope |
0.31 |
|
Isocoma acradenia |
goldenbush |
0.21 |
|
Juncus balticus |
Baltic rush |
0.21 |
|
Lasthenia californica |
goldfields |
0.42 |
|
Leymus triticoides |
creeping wild rye |
1.67 |
|
Lupinus bicolor |
miniature lupine |
0.10 |
|
Mimulus guttatus |
monkeyflower |
0.21 |
|
Poa secunda |
bluegrass |
0.10 |
|
Sporobolus airoides |
alkali sacaton |
0.83 |
|
Suaeda moquinii |
bush seepweed |
0.21 |
f. Ditch Bank Seeding and Planting
Ditches are a common feature of the agricultural landscape and are often managed with herbicides and blading to prevent the accumulation of weedy species. Native plants may prevent weedy species from overtaking ditches while providing excellent cover for wildlife.
A ditch was created on the northern and western boundary of the Section 23 restoration area (Figure 23). Seedlings of Leymus triticoides and Nassella pulchra were planted along the ditch banks in December, 2000. In January, 2001 the ditch was seeded by hand with a mix of species that would typically do well along an irrigation ditch (Table 30). The ditch was flood irrigated shortly after seeding and was not watered again.
Table 30. Seed mix and application rate for ditch bank seeding at the Tranquillity site. Seed source information provided by seed vendor.
|
Scientific name |
Common name |
Seed source |
Lbs./acre |
|---|---|---|---|
|
Amsinckia menziesii |
fiddleneck |
San Bernardino |
12.5 |
|
Cressa truxillensis |
alkali weed |
Camp Pendleton |
8.0 |
|
Eleocharis macrostachya |
spikerush |
Grass Valley |
4.2 |
|
Frankenia salina |
alkali heath |
San Diego County-Coast |
8.0 |
|
Helianthus annuus |
sunflower |
Ensenada |
8.0 |
|
Heliotropium curassavicum |
heliotrope |
Temecula |
17.0 |
|
Hordeum depressum |
low Barley |
Riverside |
21.0 |
|
Leymus triticoides |
creeping wild rye |
Fresno County |
21.0 |
|
Malvella leprosa |
alkali -mallow |
Unknown |
8.0 |
|
Nassella pulchra |
purple needle grass |
Central Valley |
12.5 |
|
Poa secunda |
bluegrass |
West Lower Central Valley |
42.0 |
|
Sporobolus airoides |
alkali sacaton |
Unknown |
12.5 |
|
Vulpia microstachys |
Nuttall's fescue |
Fresno County |
21.0 |
Vegetation monitoring was limited to periodically recording observations throughout the year. From these observations, it appeared that both Leymus triticoides and Nassella pulchra had become successfully established. Nevertheless, it remains to be seen whether or not the majority of these individuals will survive the dry season. Periodic monitoring will continue in 2002.
g. Native Plant Nursery
Because of the need to maintain local genotypes, seeds collected from local sources are preferable to commercially obtained seeds. A potentially serious problem exists when seeds or plants of different genotypes are introduced. In this manner, genetic mixing of populations adapted to different regions can occur. The introduction of non-local genotypes can produce individuals that competitively displace the local variety, or which respond to environmental cues differently than locally adapted plants. Hence, it is very important to use local seed stock to the maximum extent when implementing restoration projects.
Locating sufficient sources of native seed of local genotype has proven extremely problematic. Remnant native seed banks in the Central Valley, such as in ecological reserves and wildlife preserves, are rare and are generally quite limited in size. Furthermore, commercial suppliers of native seed often have limited supplies, are costly, and offer seed collected from geographically disjunct locations. In order to circumvent these limitations, the establishment of a Native Plant Nursery was begun in 2001 at the Tranquillity site.
Seeds from selected native species were collected during the 2001 growing season. Permission and any required permits were obtained from private landowners and government agencies. In order to minimize the mixing of local with non-local genotypes, collections were undertaken in as close a proximity to the Tranquillity site as possible. The health of the population was assessed prior to collection. No more than 5% of a population's seeds was harvested, and diseased or damaged plants were excluded from collection. Seed collections made during 2001 are listed in Table 31. With the exception of one location (Fancher and Belmont; Figure 28), all seed was collected from within 15 miles of the Tranquillity site.
Table 31. Dates, species collected, and locations of 2001 native seed collections.
|
Date |
Species collected |
Location |
|---|---|---|
|
1 May 2001 |
Phacelia distans |
Westlands property |
|
Castilleja exserta |
Fancher and Belmont |
|
|
Lasthenia chrysantha |
Fresno West Golf and CC |
|
|
Castilleja exserta |
||
|
25 June 2001 |
Hemizonia pungens |
Kerman ecological reserve, North |
|
26 June 2001 |
Hemizonia pungens |
Kerman ecological reserve, South |
|
16 July 2001 |
Hemizonia pungens |
Lanfranco property |
|
Asclepias fascicularis |
Kerman ecological reserve, South |
|
|
17 July 2001 |
Hemizonia pungens |
Kerman ecological reserve, North |
|
24 July 2001 |
Asclepias fascicularis |
|
|
Hemizonia pungens |
||
|
7 September 2001 |
Suaeda moquinii |
|
|
Hemizonia pungens |
||
|
28 September 2001 |
Sporobolus airoides |
Alkali Sink ecological reserve |
|
Frankenia salina |
||
|
Suaeda moquinii |
Kerman ecological reserve, North |
|
|
Frankenia salina |
||
|
Atriplex polycarpa |
||
|
8 October 2001 |
Isocoma acradenia |
Kerman ecological reserve, South |
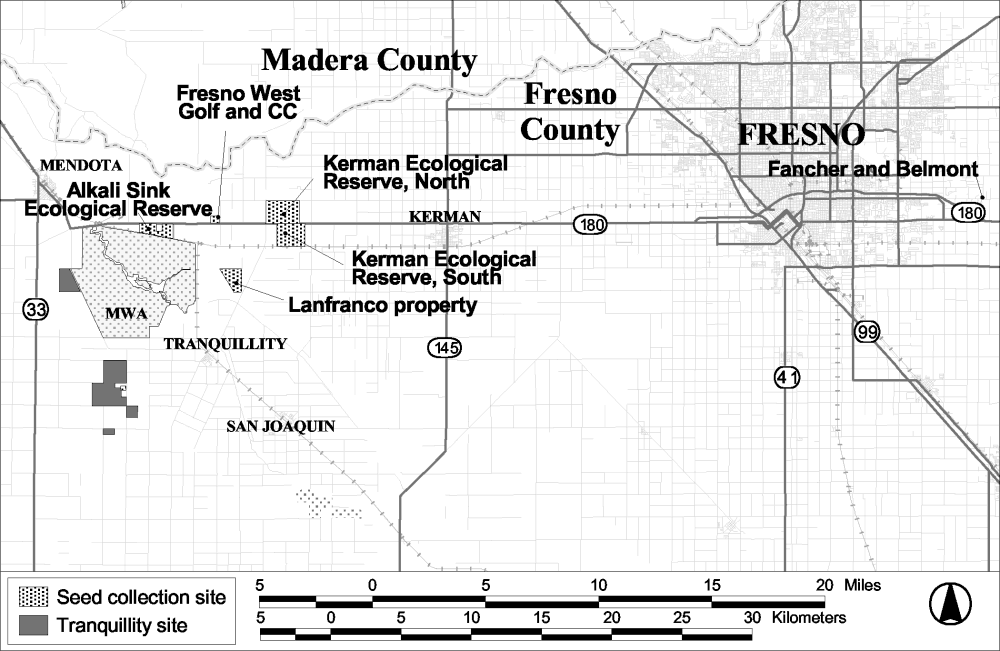
Figure 28.
Locations of native plant seed collection sites near the
Tranquillity site.
The timing of seed collection is critical, and the extremely variable springtime temperatures and rainfall patterns in the San Joaquin Valley confound scheduling. Time of collection is particularly critical for short-lived annual species. Seed collecting usually begins in the spring and lasts through late fall. Species in the genera Lasthenia , Castilleja , and Dichelostemma tend to reach maturity by early spring; hence, seed collecting can commence as early as late March or April. Late blooming shrubs such as Atriplex spp., Isocoma acradenia , and Allenrolfea occidentalis generally do not produce mature fruits until late summer or early fall, thereby extending collecting into November.
Due to an unusually warm and early spring in 2001, the collection window for many of the showy annuals was shortened. Thus, little seed was harvested from species such as Lasthenia chrysantha , Castilleja exserta , and Phacelia distans . Nevertheless, a long summer and mild fall allowed for an ample collection of Isocoma acradenia , and Hemizonia pungens .
Harvested seed was stored in paper bags, labeled with identifying codes (species, seed-lot, etc.), and dried in a seed dryer at the ESRP lab. In some cases, seed was processed to remove chaff and foreign matter. This process proved to be sufficiently difficult and time-consuming so as to preclude its general application. Additional seed was available from seed collections undertaken in 2000 (see Uptain et al, 2001), and we plan to plant these seeds in the Nursery. A complete list of the species available for planting is presented in Table 32.
Table 32. Native plants seed available for planting in the native seed nursery at the Tranquillity site. Species marked with an asterisk are those also used in the restoration seed mix.
|
Family |
Binomial |
Common name |
Life-history |
|---|---|---|---|
|
Asclepiadaceae |
Asclepias fascicularis |
narrow-leaved milkweed |
perennial herb |
|
Asteraceae |
Helianthus annuus |
sunflower |
annual herb |
|
Asteraceae |
Hemizonia pungens * |
spikeweed |
annual herb |
|
Asteraceae |
Isocoma acradenia * |
goldenbush |
shrub |
|
Asteraceae |
Lasthenia chrysantha |
alkali goldfields |
annual herb |
|
Boraginaceae |
Amsinckia menziesii |
farmer's fireweed |
annual herb |
|
Capparaceae |
Wislizenia refracta |
jackass clover |
annual herb |
|
Caryophyllaceae |
Spergularia macrotheca |
Sand Spurrey |
perennial herb |
|
Chenopodiaceae |
Atriplex polycarpa * |
valley saltbush |
shrub |
|
Chenopodiaceae |
Suaeda moquinii * |
bush seepweed |
perennial herb |
|
Euphorbiaceae |
Eremocarpus setigerus |
doveweed |
annual herb |
|
Frankeniaceae |
Frankenia salina * |
alkali heath |
perennial herb |
|
Hydrophyllaceae |
Phacelia distans |
common phacelia |
annual herb |
|
Lamiaceae |
Trichostema lanceolatum |
vinegarweed |
annual herb |
|
Liliaceae |
Dichelostemma capitatum |
blue dicks |
perennial herb |
|
Poaceae |
Sporobolus airoides * |
alkali sacaton |
perennial herb |
|
Scrophulariaceae |
Castilleja exserta |
purple owl's clover |
annual herb |
|
|||
The nursery area was disked, bermed, furrowed, and culti-packed in November, 2001. Berms were flat-topped and were sufficiently wide so as to provide space for a number of individuals. The nursery was designed to accommodate flood irrigation, as needed. Ten acres have been set aside for the nursery (see Figure 23); however, it is anticipated that only 3 acres will be used in 2002. As our stock of native seed is augmented from seed produced in the nursery and from continued collection from native populations we expect that larger areas will be put into production in subsequent years.
Some areas adjacent to the nursery site support large populations of two apparently aggressively weedy species: Sisymbrium irio , and an unidentified trifoliate species (possibly Medicago polymorpha ). It seems clear that vigilant weeding, watering, and maintenance will be necessary to ensure the successful propagation and establishment of the native species. Additionally, we are considering the use of herbicides to prepare the seed bed for the fall seeding effort in 2002.
h. Atriplex spinifera Planting
One priority of our restoration research has been the development of strategies for introducing native vegetation into Bromus madritensis subsp. rubens (red brome) dominated habitats. B. madritensis characteristically forms a heavy thatch, which inhibits the establishment of native vegetation and negatively impacts many terrestrial vertebrates, especially small mammals and lizards. Atriplex spinifera (spiny saltbush), a shrub in the Chenopodiaceae (goosefoot family), is an important component of the Valley Saltbush Scrub community, as it provides cover and forage for a variety of wildlife species. Additionally, A. spinifera represents the only species of native shrub that has managed to become established on the fallow land of Section 10 ("the Donahoe") of the Tranquillity site, an area characterized by a non-native grassland dominated by B. madritensis.
Although mature A. spinifera shrubs grow on the Donahoe, no seedlings have been identified during the three years we have studied the area. And, although A. spinifera seed has been included in the seed mix used in various restoration activities at both the Tranquillity and Atwell Island habitat restoration study sites, there has been little indication that this species can be successfully introduced by imprinting. Likewise, attempts at germinating seeds in nursery trials have met with little success.
In an attempt to investigate other means of establishing A. spinifera on restored land, we contracted with Ray Leclerc, owner of the Intermountain Nursery in Auberry (Fresno Co., California), to propagate A. spinifera from cuttings taken from existing shrubs on the Donahoe. To maximize the number of individuals produced from the original cuttings, these were rooted and then maintained as stock plants. Once a viable group of stock plants was established, cuttings were taken from these plants and used to grow out more plants. In this manner, more than 600 plants of different cohorts (i.e., age classes) were grown for transplanting to the Donahoe. Plants were maintained in approximately gallon-sized peat pots until transplanting, and were watered as deemed appropriate (approximately bi-weekly) while in the nursery.
To give us a better understanding of the species' requirements, shrubs were transplanted in groups (shrub islands) with four different configurations: 1) 10 individuals with 10-ft spacing between plants; 2) 10 individuals with 5-ft spacing; 3) 5 individuals with 10-ft spacing; and, 4) 5 individuals with 5-ft spacing. All individuals were characterized as belonging to two age classes, "old plants" and "young plants". Individuals in the oldest cohort were easily distinguished from all younger plants. Cuttings for the older plants had been rooted before the summer of 2001, such that their foliage had developed the summer-dormant appearance of spiny saltbush. Their stems were woody, their leaves small and gray-green, and their root systems were developed enough to hold soil for transplanting. Although a number of cohorts comprised the young-plants age class, identifying characteristics were not sufficiently differentiated to allow a finer resolution. Leaves that were larger, fleshier, and greener distinguished all of these younger plants, which had been rooted during the summer of 2001. These plants had less root mass than the older plants; hence, it was necessary to leave some of the youngest plants in their pots when transplanted. In these cases, pots were slashed vertically at three or four locations and the pot bottom was removed. In general, shrub islands were planted with individuals from a single age class; any departures from this were noted and mapped. Shrub islands were spaced approximately 100 ft apart along the east side of the San Luis Drain, and along the west side of the Lateral 7 Inlet Canal (Figure 23)
Transplanting was conducted November 14-29 2001. Most plants were removed from the peat pots and placed in the soil up to the plants' potting soil level. A well was created around each plant in order to concentrate water around the plant. Plants, which were left in their pots when transplanted also, were buried to the level of the potting soil. The upper lips of the pots served as wells with which to collect water. All plants were watered when planted. Subsequently, plants were watered on a weekly basis until the site received soil-soaking rains in late December. Survivorship of the plants will be monitored periodically throughout the 2002 growing season.
i. Future Directions
i. 80-acre restoration-calibration trial
As part of the restoration activities in 2002, an 80-acre block located south of Manning Ave (Figure 23) will be restored using the same seed mixture as was used for the HRS plots. To better control seed application in future restoration efforts, the Manning Avenue restoration effort will be used to refine imprinter calibration.
Our imprinter was custom made and was not calibrated by the shop that fabricated it. To date, we have data from the imprinting of both the Atwell Island HRS plot installation (setting 20 = 25 lbs/acre) and the USBLM's restoration activities at Atwell Island (setting 30; = 33.2 lbs/acre). The 80-acre parcel will be divided into four equal-sized areas and each area will be seeded with the imprinter set at a different setting (imprinter settings: 15, 25, 35, 45). Data from this trial will be compared with data from the two restoration experiments at Atwell. The amount of seed used in imprinting will be plotted against imprinter settings, and a linear regression will be calculated for the data.
ii. Succession trial
In this trial, two factors will be examined: 1) the ability of native grasses to become established when imprinted over an existing barley crop; and, 2) the relative abilities of barley and imprinted native grasses to spread beyond the confines of their seeded area.
Since the inception of the habitat restoration study, barley ( Hordeum vulgare ) has been used as a cover crop, to control weeds and prevent soil erosion (Selmon et al, 2000). Although this species has demonstrated some utility, at times its establishment has proven costly and somewhat problematic. Additionally, although the seed purchased for these studies was ostensibly of sterile barley, it has proven capable of re-seeding itself in the highly motile (i.e., shrinking, swelling, and cracking) soils at the Tranquillity site.
To date, areas cover-cropped with barley have generally been disked prior to imprinting. Although this strategy has been fairly successful in removing the greatest portion of the barley, disking represents an additional disturbance to the soil and may favor the establishment of weeds. An alternative approach to disking is imprinting seed directly over the cover crop. However, questions remain as to whether or not imprinted species will, 1) be able to become established; and, 2) be able to resist incursions by adjacent vegetation. In this trial we attempt to address these questions by monitoring temporal changes in strips of land planted with barley with those planted with native grasses ( Bromus carinatus , Hordeum depressum , Leymus triticoides , and Vulpia microstachys ).
The trial will occupy 80 acres to the north of the berm-trial area and south of the marsh-mix planting area (see Figure 23). Installation will commence in February, 2002. A stratified random blocking design will be used, with the area divided into 5 blocks. Each block will be divided into 3 strips; each strip will contain either: 1) barley (existing); 2) the native grass mix imprinted over existing barely; or, 3) the standard (for our HRS studies) 13 species restoration mix imprinted over disked ground. Seeding order will be determined randomly. The trial will be monitored periodically; if species establishment is successful, quantitative sampling will be conducted near the end of the growing season.
iii. Berm/mycorrhizal trial
This trial was designed to examine the effects of two factors: berm "architecture" and mycorrhizal inoculation. Observations at the Tranquillity HRS plots have led us to hypothesize that the establishment of micro-topography on the plots (in this case, through the construction of earthen berms) aids in the establishment of vegetation after imprinting, and may also benefit wildlife. Previously, uniform berms were installed to minimize sampling bias. Berms were compacted and rebuilt so that compaction by the imprinter would not substantially reduce the final height of the berms compared with berms that were not imprinted. This approach to berm construction required a substantial amount of time and labor. It may be more desirable to maximize the amount of bermed habitat in a restoration area by creating more (less "perfect") berms in the same amount of time. This aspect of the trial will test whether it is better to make two passes (thus, compacting the berm), or if simply making a quick berm with only one pass works just as well for facilitating native plant germination and survival.
The Tranquillity site has been in agricultural production for decades. Agricultural activities (primarily scraping and disking) can eliminate beneficial mycorrhizal fungi in the soil. Mycorrhizae-the symbiosis between a plants roots and beneficial soil fungi-aid in nutrient uptake in almost all species of plants. Half of the plots will be inoculated with commercial mycorrhizal fungi obtained from ConservaSeed. The mycorrhizal fungi will be applied by mixing it with the seed mix prior to imprinting the plots. Application rate will be ca. 60lbs/acre. Particular attention will be given to species that are mycotrophs and net-builders to see if they perform better in the inoculated plots.
The berm and mycorrhizal trial will be installed in February or March 2002 and will occupy 10 acres in 5 blocks, each with 4 (0.5 acre) plots. A stratified random blocking design will be used. The blocks will be located north and west of the nursery (Figure 23). Each plot will contain seven evenly spaced berms oriented east to west. Berms will be spaced 30 ft apart from their centers, and will begin 10 ft from the north edge of the plot. A barley buffer will be maintained to the north and south of the plots. Plots will be separate on the eastern and western sides by approximately 85' wide strips. However, these will be planted to barley. The berms will be continuous through adjacent plots (i.e., the berms do not stop within the plot boundaries, but continue into adjacent plots).
Prior to installation of the berms, the ground will be prepared by disking and harrowing with a spring-toothed harrow. The berms will be created using a 2-disk border disc and a cultipacker. Plots will be imprinted with the usual restoration seed mix at the rate of 50 pounds per acre with mycorrhizal inoculum added to the designated plots.
iv. Watering trial
The watering requirements for two plant species, Atriplex polycarpa and Leymus triticoides will be investigated. Objectives are to determine whether these species, when transplanted from plugs: 1) require watering to survive through the first summer; and, 2) at which point watering can be terminated while still ensuring a high survival rate.
Seedlings were grown by Westside Transplants (Firebaugh, CA) in the latter half of 2001. It is anticipated that the trial will commence in early 2002. Seedlings will be planted along the eastern edge of the northwestern corner of Section 23 (Figure 23). Each species will be planted in "plots" consisting of either 9 A. polycarpa or 18 L. triticoides individuals. Spacing between plants will be 4 ft for both species. Spacing was based on maximum planting densities as recommended by the USDA.
Plots will be arranged in a randomized block design of five blocks. Each block will contain four plots, with each plot being assigned one of four, randomly assigned, watering regimes. Watering will be conducted once a week. In order to facilitate watering, plots will be situated in close proximity (ca. 25-30') from the road that delineates the eastern side of the study area. Watering will be carried out using a pickup truck outfitted with a small gas-powered pump and three 55-gallon tanks. Anticipated watering rate is approximately 0.75 gallon of water/plant/week. Experimental treatments will be: 1) no watering after the estimated final rain of the season; 2) watering for 2 months after the final rain; 3) watering for 3 months after the final rain; and, 4) watering for 4 months after the final rain.
v. Suitability trial
To broaden the selection of species used in our restoration activities, an analysis of the suitability of a variety of species was initiated. A list was compiled of species that had been used in other restoration projects or which seemed to be likely candidates for inclusion in restoration activities. The resulting 43 potential species were then ranked based on a series of criteria (listed in alphabetical order):
- active growth period
- adapted for clay soil
- availability (from suppliers)
- cost per pound of PLS (pure live seed)
- drought tolerance
- fire tolerance
- growth rate
- known from the county
- known from nearby reserves
- legal weed status
- life history (e.g., annual/perennial)
- life-form (e.g., shrub, forb, etc.)
- mature height
- minimum precipitation requirement
- mycorrhizal status
- pretreatment requirements
- salt tolerance
- ability to withstand high levels of sunlight
Based on this evaluation, four grasses, Elymus glaucus , E. multisetus , Nassella cernua , and N. pulchra , and a single broadleaf species, Eriogonum fasciculatum (Polygonaceae), were selected for planting. Bromus carinatus , a grass that we have imprinted in other trials, was selected to serve as a control.
Installation of the trial is scheduled for late winter, 2002. Each species will be imprinted in a 0.33-acre strip (~ 12 x 1,200 ft). In order to facilitate comparisons among species, seeding rates will be calibrated so that each species is seeded at 35 PLS (pure live seeds) per square foot. The trial will be monitored periodically; if species establishment is successful it will be quantitatively sampled towards the end of the growing season.
2. Biological Monitoring
IN 2001, ESRP conducted monitoring on a site-wide basis that is not directly related to the Tranquillity Habitat Restoration Study. Monitoring consisted of:
- spotlighting surveys;
- track station surveys;
- winter raptor surveys; and
- contaminants sampling (vegetation, invertebrates, and small mammals).
The locations where the spotlighting, track station, and winter raptor surveys were conducted is presented in Figure 29. Because the contaminants locations are relatively complex, the locations where sampling occurred is presented in a separate figure in the contaminants section (section 2 d) of this document.
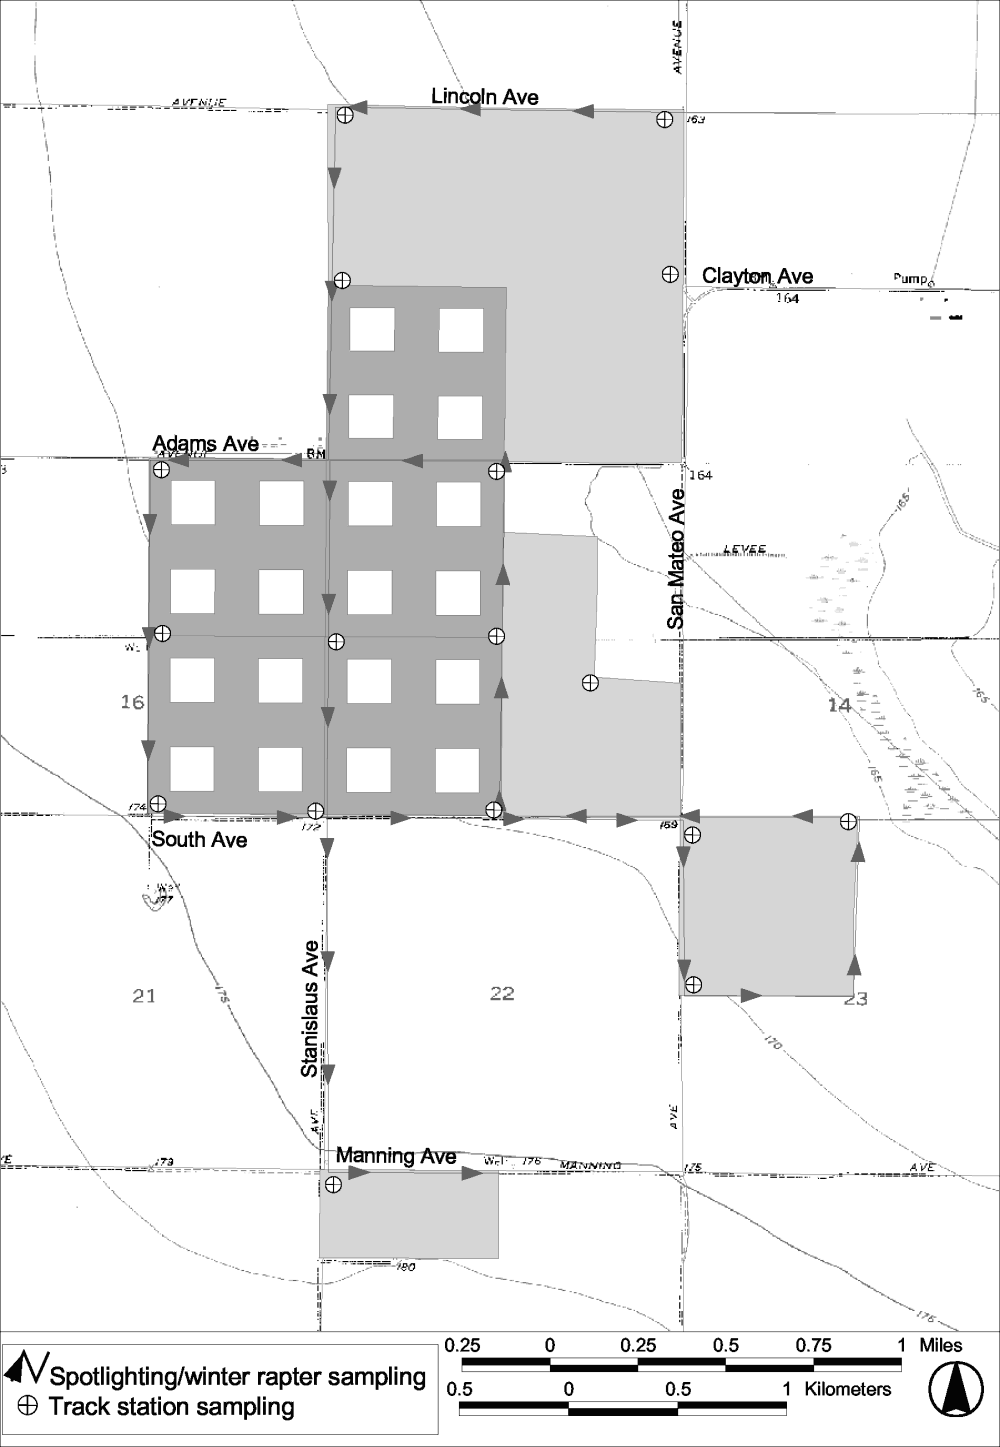
Figure 29.
Sampling locations for site-wide biological monitoring at the
Tranquillity site.
a. Spotlighting Surveys
i. Methods
Spotlighting surveys at the Tranquillity site were conducted on 29-31May, 17-19 September, and 17-19 December 2001 following methods that have been previously presented (Uptain et al. 2001). The first quarter (spring) spotlighting effort was cancelled due to heavy rains and consequent lack of access to the study site.
ii. Results
There was seasonal variability in species richness during the spotlighting surveys, but there was also a trend of increasing species richness from 1999 to 2001 (Table 33). No single species was present during all census periods, but barn owls ( Tyto alba ), black-tailed jackrabbits ( Lepus californicus ), desert cottontails ( Sylvilagus audubonii ), and short-eared owls were present most seasons. Although seasonal composition of species varied, barn owls, black-tailed hares, desert cottontails and red-tailed hawks ( Buteo jamaicensis ) generally ranked within the top three most abundant species (Table 33). Barn owls were the most abundant species during five of the nine census periods and ranked within the top three most abundant species during seven of the census periods.
Table 33. Rates of species occurrence during 1999 to 2001 spotlighting surveys at the Tranquillity site.
|
Common name |
Rate 1 |
||||||||
|---|---|---|---|---|---|---|---|---|---|
|
1999 |
2000 |
2001 |
|||||||
|
Fall |
Winter |
Spring |
Summ. |
Fall |
Winter |
Summ. |
Fall |
Winter |
|
|
western toad |
0.09 |
0 |
0.20 |
0.86 |
0.03 |
0 |
0.20 |
0.17 |
0 |
|
California king snake |
0 |
0 |
0 |
0.03 |
0 |
0 |
0 |
0.03 |
0 |
|
black-crowned night heron |
0 |
0 |
0 |
0 |
0 |
0 |
0.66 |
0 |
0 |
|
burrowing owl |
0.09 |
0.09 |
0.35 |
0.14 |
0 |
0 |
0 |
0 |
0 |
|
duck |
0 |
0 |
0 |
0 |
0 |
0 |
0.03 |
0 |
0 |
|
egret |
0 |
0 |
0 |
0 |
0 |
0 |
0.03 |
0 |
0 |
|
killdeer |
0 |
0 |
0.09 |
0.03 |
0.06 |
0.40 |
0 |
0 |
0.06 |
|
lesser nighthawk |
0 |
0 |
0 |
0 |
0 |
0 |
0 |
0.03 |
0 |
|
red-tailed hawk |
0 |
0.58 |
0 |
0 |
0.26 |
0.40 |
0.03 |
0.29 |
0.32 |
|
western Meadowlark |
0 |
0 |
0 |
0 |
0 |
0 |
0 |
0.09 |
0 |
|
black-tailed hare |
0.12 |
0.20 |
0.23 |
0.32 |
0.12 |
0.03 |
0.17 |
0.26 |
0 |
|
desert cottontail |
0.12 |
0 |
0.37 |
0.23 |
0.06 |
0.09 |
0.12 |
0.35 |
0.23 |
|
coyote |
0 |
0 |
0.06 |
0 |
0 |
0.09 |
0.06 |
0 |
0 |
|
dog |
0 |
0 |
0 |
0 |
0 |
0.03 |
0 |
0 |
0 |
|
kangaroo rat |
0 |
0 |
0.03 |
0.23 |
0 |
0 |
0 |
0.17 |
0 |
|
mouse |
0 |
0 |
0 |
0 |
0.03 |
0 |
0.32 |
0.20 |
0 |
|
California ground squirrel |
0 |
0 |
0 |
0 |
0 |
0.03 |
0 |
0 |
0 |
|
California vole |
0.03 |
0 |
0 |
0 |
0 |
0 |
0.06 |
0.06 |
0 |
|
unknown |
0 |
0 |
0 |
0 |
0 |
0 |
0.03 |
0 |
0 |
|
Species Richness |
7 |
4 |
8 |
9 |
8 |
9 |
13 |
12 |
4 |
|
|||||||||
iii. Discussion
As restoration on the Tranquillity site continues, we would expect the species composition and abundance to shift. Greater numbers of kangaroo rats, mice, black-tailed hares, and desert cottontails would be expected. A concomitant increase in predators would also be expected.
b. Track Station Surveys
i. Methods
Track station surveys of the Tranquillity site were conducted on 14-16 March, 30 May-1 June, 9-11 September, and 18-20 December 2001 using methods that have been previously presented (Uptain et al. 2001).
ii. Results
Mean species richness at the track stations was variable throughout the survey duration (Figure 30). The lowest seasonal richness was observed in fall and winter 1999. The highest richness was observed in summer 2000 and spring 2001, although fall 2001 also had relatively high richness values. Similarly, the abundance of tracks at the track stations was quite variable (Figure 31). The lowest seasonal abundance values were in fall and winter 1999 and spring of 2000, whereas the highest seasonal abundance values were in summer 2000. Mammals exhibited the greatest frequency of visitation and the greatest rate of visitation, except in summer and winter 2000, when invertebrates exhibited the greatest rate of visitation (Table 34). Reptiles were conspicuously absent from the track stations.
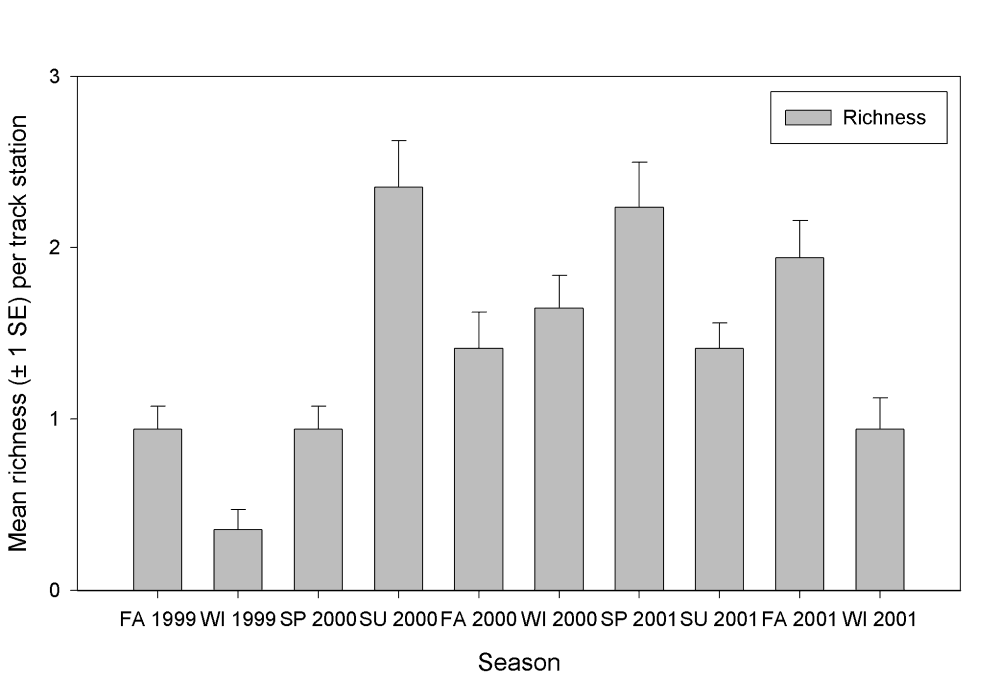
Figure 30.
Seasonal richness of tracks observed on the track stations at
the Tranquillity site, 1999 through 2001.
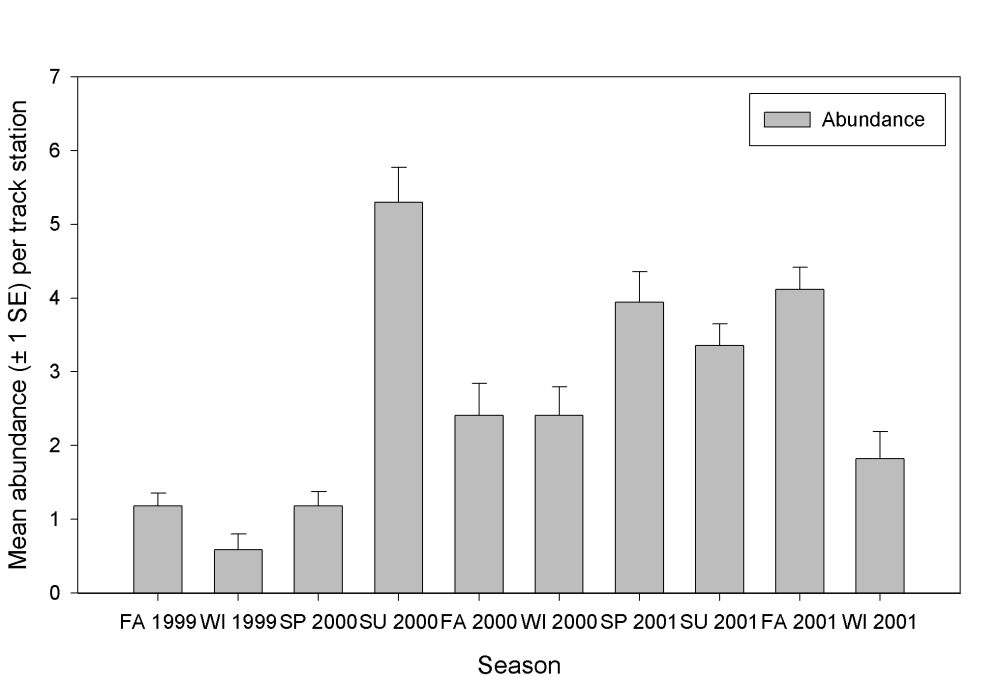
Figure 31.
Seasonal abundance of tracks observed on the track stations at
the Tranquillity site, 1999 through 2001.
Table 34. Frequency and rate of visitation of wildlife at track stations at the Tranquillity site, 1999 through 2001.
|
Season |
Invertebrates |
Amphibians |
Reptiles |
Birds |
Mammals |
|||||
|---|---|---|---|---|---|---|---|---|---|---|
|
Freq. 1 |
Rate 2 |
Freq. 1 |
Rate 2 |
Freq. 1 |
Rate 2 |
Freq. 1 |
Rate 2 |
Freq. 1 |
Rate 2 |
|
|
Fall 1999 |
100.0 |
0.18 |
0 |
0 |
0 |
0 |
0 |
0 |
100.0 |
0.14 |
|
Winter 1999 |
0 |
0 |
0 |
0 |
0 |
0 |
0 |
0 |
100.0 |
0.12 |
|
Spring 2000 |
33.3 |
0.08 |
0 |
0 |
0 |
0 |
33.3 |
0.06 |
33.3 |
0.18 |
|
Summer 2000 |
100.0 |
0.29 |
100.0 |
0.10 |
0 |
0 |
100.0 |
0.18 |
100.0 |
0.24 |
|
Fall 2000 |
100.0 |
0.21 |
66.7 |
0.06 |
0 |
0 |
100.0 |
0.04 |
100.0 |
0.16 |
|
Winter 2000 |
66.7 |
0.25 |
33.3 |
0.02 |
0 |
0 |
100.0 |
0.08 |
100.0 |
0.20 |
|
Spring 2001 |
100.0 |
0.12 |
66.7 |
0.04 |
0 |
0 |
100.0 |
0.14 |
100.0 |
0.31 |
|
Summer 2001 |
66.7 |
0.06 |
33.3 |
0.02 |
0 |
0 |
33.3 |
0.04 |
100.0 |
0.31 |
|
Fall 2001 |
66.7 |
0.16 |
66.7 |
0.04 |
33.3 |
0.02 |
100.0 |
0.06 |
100.0 |
0.31 |
|
Winter 2001 |
33.3 |
0.10 |
0 |
0 |
0 |
0 |
33.3 |
0.10 |
100.0 |
0.20 |
|
||||||||||
iii. Discussion
The high variability of track richness, abundance, frequency, and rate indicates that wildlife populations on the site are not showing a clear trend of steadily increasing numbers and not exhibiting an expansion in distribution. An increasing trend in wildlife numbers and expanding distributions would be expected on a site-wide basis in a response to restoration efforts, or even in response to the establishment of fallow fields. The lack of steadily increasing wildlife numbers or increasing distributions may not reflect responses to restoration, but rather, it may be related to the variability of seasonal and yearly climactic conditions in the San Joaquin Valley.
c. Winter Raptor Survey
i. Methods
The annual winter raptor survey was conducted from 18-20 December 2001 following methods that have been previously presented (Uptain et al. 2001).
ii. Results
Loggerhead shrikes ( Lanius ludovicianus ) and eight species of raptors were observed during the 2001 winter survey (Table 35). American kestrel ( Falco sparverius ) and northern harrier were the most prevalent raptor species observed. Red-tailed hawks, loggerhead shrikes, and white-tailed kites ( Elanus leucurus ) also were frequently observed. One peregrine falcon ( Falco peregrinus ), one rough-legged hawk ( Buteo lagupus ), and two ferruginous hawks ( Buteo regalis ) comprise the uncommon species that were recorded during the census.
Numbers of northern harriers increased slightly since 1999 (Table 35). Loggerhead shrikes were not recorded in 1999, but have increased in rate of occurrence since the 2000 census. The occurrence rates of both American kestrels and white-tailed kites have fluctuated throughout the 3 years of this census.
Table 35. Frequency and rate of occurrence of bird species observed at the Tranquillity site, 1999 - 2001.
|
Species |
1999 |
2000 |
2001 |
|||||||
|---|---|---|---|---|---|---|---|---|---|---|
|
Common name |
Scientific name |
Total |
Freq1 |
Rate2 |
Total |
Freq1 |
Rate2 |
Total |
Freq1 |
Rate2 |
|
white-tailed kite |
Elanus caeruleus |
6 |
66.7 |
17.1 |
15 |
100.0 |
45.0 |
7 |
100.0 |
18.8 |
|
ferruginous hawk |
Buteo regalis |
- |
- |
- |
- |
- |
- |
3 |
66.7 |
8.0 |
|
prairie falcon |
Falco mexicanus |
1 |
33.3 |
2.9 |
1 |
33.3 |
3.0 |
- |
- |
- |
|
unidentified falcon |
Falco sp. |
- |
- |
- |
1 |
33.3 |
3.0 |
- |
- |
- |
|
loggerhead shrike 3 |
Lanius ludovicianus |
- |
- |
- |
11 |
100.0 |
33.0 |
14 |
100.0 |
37.5 |
|
||||||||||
iii. Discussion
This year was the first in which either a peregrine falcon or a ferruginous hawk, both of which are special status species, was seen on the Tranquillity site. The peregrine falcon was observed in pursuit of a small passerine species over one of the study plots. It is possible that both of these species have foraged on the study plots in the past, but were not present during an avian census or noticed while other field work was being conducted. Although the prairie falcon was not recorded during the 2001 winter raptor survey, it was observed during the quarterly avian survey in October 2001.
Home-range size varies among raptor species and generally can be correlated with prey availability, season, and habitat structure. Thus, fluctuations in occurrence rates at the LRDP site for many raptor species are likely attributable to larger landscape-level factors than to plot-level variables.
d. Contaminants Monitoring
i. Methods
Monitoring of selenium contamination of the Tranquillity site followed methods previously presented (Uptain et al. 2001). Vegetation, invertebrate, and small mammal samples were collected from the locations shown in Figure 32. Vegetation sampling was conducted on 10-11 May 2001, invertebrate sampling was conducted on 19-22 June 2001, and small mammal sampling was conducted on 5-6 September 2001. The sampling locations were classified as cultivated areas, uncultivated areas, and experimental areas. Cultivated areas were those where barley is being grown on the site or where other crops are being grown directly adjacent to the LRDP site. Uncultivated areas are those that are fallowed or idled. Samples from experimental areas are those taken directly from the HRS study plots. In previous analyses of contaminant data collected from the Tranquillity site (Selmon et al. 2000, Uptain et al. 2001), geometric means were not calculated for any group of data where one sample or more within a group had a selenium level below the detection limit. This limited our ability to interpret trends in the level of selenium contamination for several groups of data. In this report, when a sample contained less than the detection limit, the value for that sample was set at half the detection limit and a geometric mean was calculated for the data group. Geometric means are used rather than standard means or medians because biota tend to accumulate selenium in a non-linear fashion.
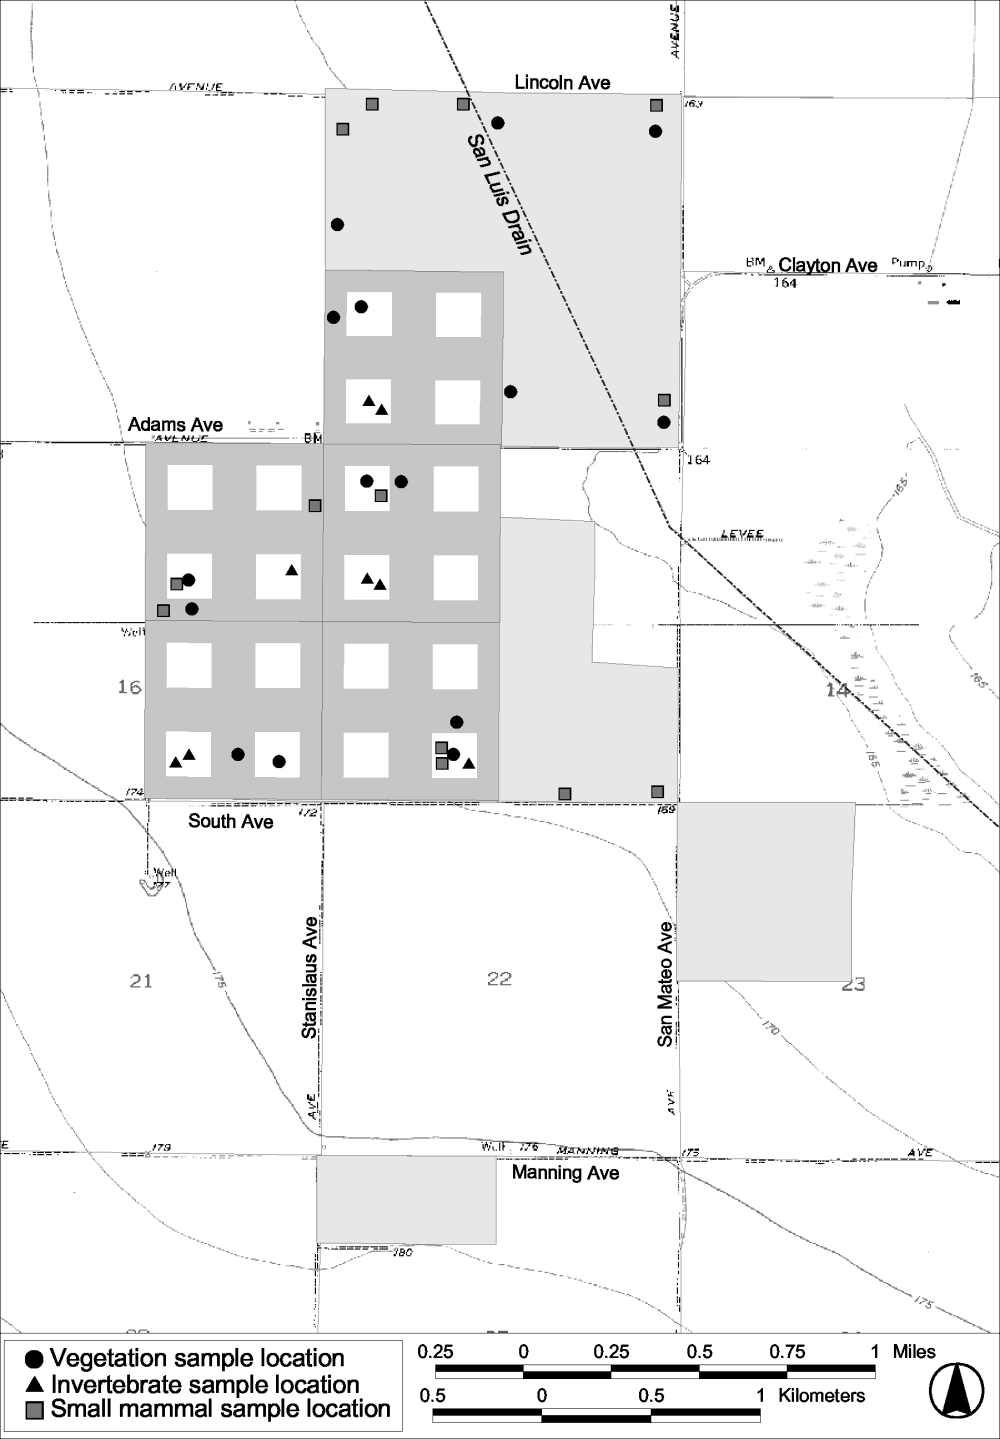
Figure 32.
Sampling locations for contaminant monitoring at the
Tranquillity site.
ii. Results
Vegetation
There were very few vegetation samples collected from any of the three collection areas (cultivated, uncultivated, and experimental) for selenium analysis in 1999 (Table 36). There were a variety of reasons for this including:
- the project was begun late in the year, when many of the plant species were dead and dried, making collections problematic,
- The cultivated and experimental areas were planted in irrigated barley, which containing a paucity of other species
- Project protocols were being developed, delaying implementation of some sampling, including the collection of contaminant samples.
Selenium concentrations in the four species collected in 1999, regardless of collection area, averaging 0.40 mg/kg or less). Similarly, in 2000 the mean selenium concentrations in most species remained at or below 0.50 mg/kg, except for Brassica nigra from cultivated areas, which had mean selenium concentrations of 0.96 and 1.01 mg/kg in seeds and vegetation. Similarly, Brassica nigra also had high selenium concentrations relative to other species in the experimental area in both 2000 and 2001. Selenium concentrations of all species sampled did not appreciably increase from 2000 to 2001.
We combined samples from each year into groups representing selenium accumulators ( Brassica nigra , Distichlis spicata , Heliotropium curassavicum , and Sesuvium verrucosum ) and non-accumulators for each of the three areas (cultivated, experimental, and uncultivated). This was done to increase the sample sizes (thus increasing the robustness of the results) and to compare selenium concentrations between accumulators and non-accumulators across sampling areas and years. Selenium concentrations in vegetation (either whole plant or seed) did not increase from 1999 to 2001 in any of the three collection areas at the Tranquillity site (Table 37). The group of accumulator plants did not vary across years or sampling areas to any great degree. Furthermore, the group of accumulator plants did not accumulate selenium at levels considered indicative of selenium accumulators (500 to 1,000 mg/kg).
Table 36 . Selenium concentrations in plant species collected from the Tranquillity site
|
Land use |
Taxon code 1 |
Part |
1999 |
2000 |
2001 |
||||||||||||
|---|---|---|---|---|---|---|---|---|---|---|---|---|---|---|---|---|---|
|
N |
Min |
Max |
Mean |
SE |
N |
Min |
Max |
Mean |
SE |
N |
Min |
Max |
Mean |
SE |
|||
|
Cultivated |
ATAR |
Veg |
1 |
0.20 |
0.20 |
0.20 |
0.00 |
|
|
|
|
|
|
|
|
|
|
|
Whole |
|
|
|
|
|
5 |
0.10 |
0.63 |
0.37 |
0.11 |
|
|
|
|
|
||
|
AVFA |
Whole |
|
|
|
|
|
5 |
0.20 |
0.40 |
0.33 |
0.04 |
|
|
|
|
|
|
|
BRNI |
Seeds |
|
|
|
|
|
4 |
0.64 |
1.60 |
0.96 |
0.22 |
|
|
|
|
|
|
|
Veg |
|
|
|
|
|
4 |
0.30 |
1.70 |
1.01 |
0.32 |
|
|
|
|
|
||
|
HOVU |
Seeds |
|
|
|
|
|
5 |
0.10 |
0.40 |
0.24 |
0.05 |
5 |
0.10 |
0.50 |
0.20 |
0.07 |
|
|
Veg |
|
|
|
|
|
5 |
0.10 |
0.63 |
0.26 |
0.09 |
11 |
0.30 |
1.30 |
0.43 |
0.09 |
||
|
MEIN |
Veg |
|
|
|
|
|
|
|
|
|
|
3 |
0.10 |
0.40 |
0.16 |
0.10 |
|
|
SIIR |
Veg |
1 |
0.40 |
0.40 |
0.40 |
0.00 |
|
|
|
|
|
|
|
|
|
|
|
|
Experimental |
ATAR |
Veg |
2 |
0.10 |
0.50 |
0.22 |
0.20 |
1 |
0.50 |
0.50 |
0.50 |
0.00 |
4 |
0.10 |
1.10 |
0.34 |
0.23 |
|
Whole |
|
|
|
|
|
4 |
0.10 |
0.40 |
0.26 |
0.07 |
|
|
|
|
|
||
|
ATPO |
Veg |
|
|
|
|
|
|
|
|
|
|
4 |
0.10 |
1.00 |
0.28 |
0.20 |
|
|
AVFA |
Whole |
|
|
|
|
|
5 |
0.10 |
0.50 |
0.25 |
0.07 |
|
|
|
|
|
|
|
BEVU |
Whole |
|
|
|
|
|
4 |
0.10 |
0.73 |
0.33 |
0.13 |
|
|
|
|
|
|
|
BRMA |
Seeds |
|
|
|
|
|
|
|
|
|
|
1 |
0.10 |
0.10 |
0.10 |
0.00 |
|
|
BRNI |
Seeds |
|
|
|
|
|
4 |
0.40 |
0.50 |
0.42 |
0.03 |
1 |
0.50 |
0.50 |
0.50 |
0.00 |
|
|
Veg |
|
|
|
|
|
4 |
0.10 |
0.88 |
0.44 |
0.18 |
1 |
0.60 |
0.60 |
0.60 |
0.00 |
||
|
HOMU |
Whole |
|
|
|
|
|
1 |
0.10 |
0.10 |
0.10 |
0.00 |
|
|
|
|
|
|
|
HOVU |
Seeds |
5 |
0.10 |
0.30 |
0.20 |
0.04 |
5 |
0.10 |
0.40 |
0.17 |
0.07 |
|
|
|
|
|
|
|
Veg |
5 |
0.10 |
0.40 |
0.20 |
0.05 |
5 |
0.10 |
0.50 |
0.18 |
0.09 |
|
|
|
|
|
||
|
SUMO |
Veg |
|
|
|
|
|
|
|
|
|
|
5 |
0.30 |
2.60 |
0.51 |
0.45 |
|
|
Uncultivated |
ATAR |
Veg |
3 |
0.10 |
0.50 |
0.17 |
0.13 |
|
|
|
|
|
5 |
0.10 |
0.30 |
0.16 |
0.04 |
|
Whole |
|
|
|
|
|
5 |
0.10 |
0.20 |
0.11 |
0.02 |
|
|
|
|
|
||
|
BRMA |
Seeds |
|
|
|
|
|
|
|
|
|
|
5 |
0.10 |
0.10 |
0.10 |
0.00 |
|
|
Whole |
|
|
|
|
|
5 |
0.10 |
0.20 |
0.11 |
0.02 |
|
|
|
|
|
||
|
BRNI |
Seeds |
|
|
|
|
|
5 |
0.10 |
0.60 |
0.20 |
0.09 |
5 |
0.10 |
0.30 |
0.18 |
0.04 |
|
|
Veg |
|
|
|
|
|
5 |
0.10 |
0.40 |
0.19 |
0.06 |
5 |
0.10 |
0.50 |
0.26 |
0.07 |
||
|
HECU |
Seeds |
1 |
0.10 |
0.10 |
0.10 |
0.00 |
|
|
|
|
|
|
|
|
|
|
|
|
Veg |
1 |
0.10 |
0.10 |
0.10 |
0.00 |
|
|
|
|
|
1 |
0.40 |
0.40 |
0.40 |
0.00 |
||
|
Whole |
|
|
|
|
|
5 |
0.10 |
0.40 |
0.19 |
0.06 |
|
|
|
|
|
||
|
HOMU |
Whole |
|
|
|
|
|
3 |
0.10 |
0.30 |
0.14 |
0.07 |
|
|
|
|
|
|
|
MEIN |
Veg |
|
|
|
|
|
|
|
|
|
|
5 |
0.10 |
0.30 |
0.17 |
0.05 |
|
|
PHDI |
Seeds |
|
|
|
|
|
|
|
|
|
|
3 |
0.10 |
0.20 |
0.16 |
0.03 |
|
|
Veg |
|
|
|
|
|
|
|
|
|
|
3 |
0.15 |
0.30 |
0.21 |
0.04 |
||
|
|||||||||||||||||
Table 37 . Selenium concentrations in plant species grouped as selenium accumulators and selenium non-accumulators at the Tranquillity site
|
Land use |
Accum. |
Part |
1999 |
2000 |
2001 |
||||||||||||
|---|---|---|---|---|---|---|---|---|---|---|---|---|---|---|---|---|---|
|
N |
Min |
Max |
GM |
SE |
N |
Min |
Max |
GM |
SE |
N |
Min |
Max |
GM |
SE |
|||
|
Cultivated |
No |
Seeds |
|
5 |
0.10 |
0.40 |
0.24 |
0.05 |
5 |
0.10 |
0.50 |
0.20 |
0.07 |
||||
|
Veg |
1 |
0.20 |
0.20 |
0.20 |
0.00 |
6 |
0.10 |
0.63 |
0.30 |
0.09 |
14 |
0.10 |
1.30 |
0.35 |
0.08 |
||
|
Whole |
1 |
0.40 |
0.40 |
0.40 |
0.00 |
9 |
0.10 |
0.63 |
0.33 |
0.06 |
|
|
|
|
|
||
|
Yes |
Seeds |
|
|
|
|
|
4 |
0.64 |
1.60 |
0.96 |
0.22 |
|
|
|
|
|
|
|
Veg |
|
|
|
|
|
4 |
0.30 |
1.70 |
1.01 |
0.32 |
|
|
|
|
|
||
|
Experimental |
No |
Seeds |
5 |
0.10 |
0.30 |
0.20 |
0.04 |
5 |
0.10 |
0.40 |
0.17 |
0.07 |
1 |
0.10 |
0.10 |
0.10 |
0.00 |
|
Veg |
7 |
0.10 |
0.50 |
0.21 |
0.06 |
6 |
0.10 |
0.50 |
0.22 |
0.08 |
13 |
0.10 |
2.60 |
0.37 |
0.19 |
||
|
Whole |
|
|
|
|
|
14 |
0.10 |
0.73 |
0.26 |
0.05 |
|
|
|
|
|
||
|
Yes |
Seeds |
|
|
|
|
|
4 |
0.40 |
0.50 |
0.42 |
0.03 |
1 |
0.50 |
0.50 |
0.50 |
0.00 |
|
|
Veg |
|
|
|
|
|
4 |
0.10 |
0.88 |
0.44 |
0.18 |
1 |
0.60 |
0.60 |
0.60 |
0.00 |
||
|
Uncultivated |
No |
Seeds |
|
|
8 |
0.10 |
0.20 |
0.12 |
0.02 |
||||||||
|
Veg |
3 |
0.10 |
0.50 |
0.17 |
0.13 |
1 |
0.10 |
0.10 |
0.10 |
0.00 |
13 |
0.10 |
0.30 |
0.17 |
0.02 |
||
|
Whole |
|
|
|
|
|
12 |
0.10 |
0.30 |
0.12 |
0.02 |
|
|
|
|
|
||
|
Yes |
Seeds |
1 |
0.10 |
0.10 |
0.10 |
0.00 |
5 |
0.10 |
0.60 |
0.20 |
0.09 |
5 |
0.10 |
0.30 |
0.16 |
0.05 |
|
|
Veg |
1 |
0.10 |
0.10 |
0.10 |
0.00 |
5 |
0.10 |
0.10 |
0.19 |
0.06 |
6 |
0.10 |
0.50 |
0.28 |
0.06 |
||
|
Whole |
|
|
|
|
|
3 |
0.10 |
3.90 |
1.12 |
1.22 |
|
|
|
|
|
||
Invertebrates
Selenium concentrations in the four groups of invertebrates sampled (beetles, crickets, isopods, and spiders) did not vary from 1999 to 2001 (Table 38, Figure 33). However, there is a slight trend of increasing selenium levels in all groups except spiders. Isopods exhibited the highest concentrations of selenium levels in all years.
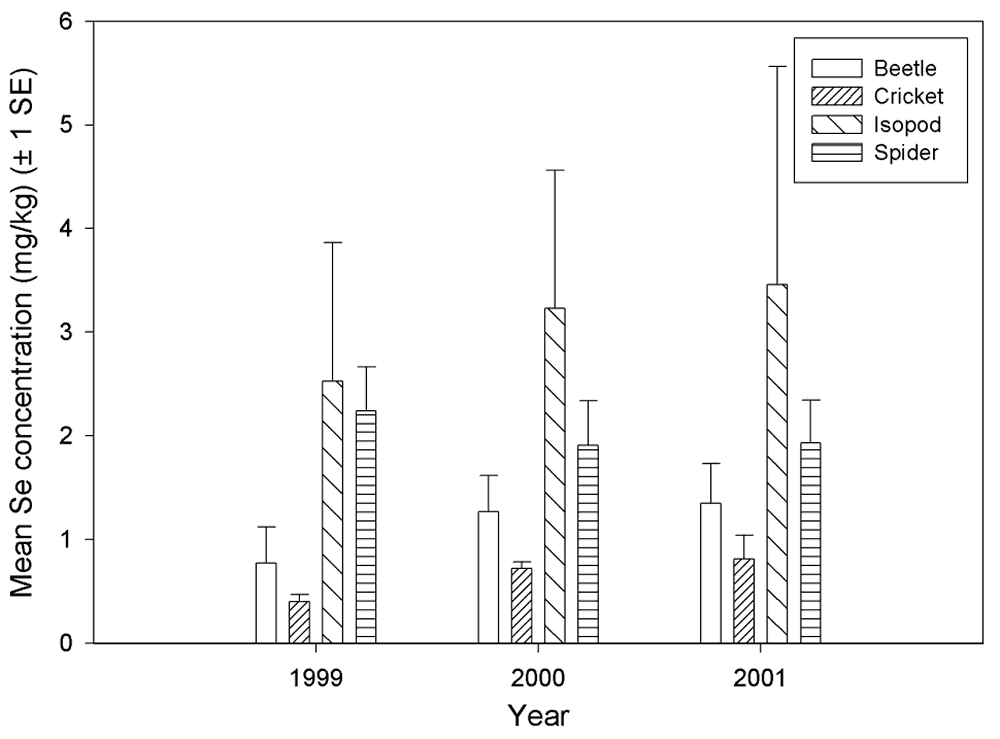
Figure 33.
Selenium concentrations in invertebrates sampled from the
Tranquillity site.
Table 38 . Selenium concentrations in invertebrate species collected from the Tranquillity site
|
Land use |
Taxon group |
Part |
1999 |
2000 |
2001 |
||||||||||||
|---|---|---|---|---|---|---|---|---|---|---|---|---|---|---|---|---|---|
|
N |
Min |
Max |
mean |
SE |
N |
Min |
Max |
mean |
SE |
N |
Min |
Max |
mean |
SE |
|||
|
Experimental |
Beetles |
Body |
2 |
0.50 |
1.20 |
0.77 |
0.35 |
5 |
0.60 |
2.70 |
1.27 |
0.35 |
5 |
0.70 |
2.80 |
1.35 |
0.38 |
|
Crickets |
Body |
4 |
0.30 |
0.60 |
0.40 |
0.07 |
5 |
0.40 |
1.20 |
0.72 |
0.07 |
5 |
0.50 |
1.80 |
0.81 |
0.23 |
|
|
Isopods |
Body |
3 |
1.00 |
5.60 |
2.53 |
1.33 |
5 |
2.20 |
4.50 |
3.23 |
1.33 |
5 |
2.10 |
13.00 |
3.46 |
2.10 |
|
|
Spiders |
Body |
5 |
1.10 |
3.60 |
2.24 |
0.43 |
5 |
0.90 |
2.70 |
1.91 |
0.43 |
5 |
0.95 |
3.20 |
1.93 |
0.41 |
|
Small mammals
Body and liver samples of small mammals collected from all sample locations (cultivated, uncultivated, and experimental) did not vary in selenium concentrations from 1999 to 2001 (Table 39). However, there are trends of decreasing concentrations of selenium in all groups sampled for all sample locations. ). The selenium levels in all small mammals captured during all seasons remain below the level considered to be problematic (5 ppm).
Table 39 . Selenium concentrations in mammal species collected from the Tranquillity site
|
Land use |
Taxon code 1 |
Part |
1999 |
2000 |
2001 |
||||||||||||
|---|---|---|---|---|---|---|---|---|---|---|---|---|---|---|---|---|---|
|
N |
Min |
Max |
mean |
SE |
N |
Min |
Max |
mean |
SE |
N |
Min |
Max |
mean |
SE |
|||
|
Cultivated |
PEMA |
Body |
5 |
1.00 |
1.50 |
1.21 |
0.08 |
5 |
0.95 |
1.70 |
1.42 |
0.14 |
6 |
0.91 |
1.40 |
1.19 |
0.08 |
|
Liver |
5 |
3.30 |
3.90 |
3.57 |
0.10 |
5 |
3.10 |
5.50 |
3.84 |
0.42 |
6 |
2.30 |
3.80 |
3.11 |
0.20 |
||
|
Experimental |
SOOR |
Body |
|
13 |
2.00 |
4.80 |
2.51 |
0.21 |
6 |
1.60 |
2.90 |
1.95 |
0.19 |
||||
|
Liver |
|
|
|
|
|
13 |
3.40 |
7.80 |
4.18 |
0.34 |
6 |
2.90 |
5.80 |
3.65 |
0.45 |
||
|
Uncultivated |
PEMA |
Body |
5 |
0.75 |
1.10 |
0.94 |
0.07 |
5 |
0.73 |
1.00 |
0.82 |
0.05 |
5 |
0.50 |
0.85 |
0.63 |
0.06 |
|
Liver |
5 |
2.90 |
4.40 |
3.58 |
0.28 |
5 |
1.60 |
3.90 |
2.67 |
0.42 |
5 |
0.74 |
2.30 |
1.56 |
0.29 |
||
|
|||||||||||||||||
iii. Discussion
The results of our monitoring to date indicate that bio-accumulation of selenium does not appear to be a concern on retired agricultural land at the Tranquillity site. .Selenium levels in most biotic groups sampled on the Tranquillity site generally fall within the range of typical background levels. Typical background levels of selenium in terrestrial plants range from 0.01 - 0.6 mg/kg (USDI 1998). Brassica nigra collected from cultivated areas exceeded this range, but B . nigra is a known selenium accumulator. Known selenium accumulators can accumulate selenium to levels as high as 500 - 1,000 mg/kg (Rosenfeld and Beath 1964), far exceeding the levels observed in B . nigra . Typical background selenium levels of terrestrial invertebrates are 0.1 - 2.5 mg/kg. The mean (geometric mean) selenium level of beetles and crickets fell within this range, but selenium levels in isopods and spiders slightly exceeded this range. Selenium levels in spiders and isopods are expected to exceed those in beetles and crickets because of dietary differences that lead to bio-accumulation of selenium. Beetles and crickets generally feed on vegetation whereas spiders are predatory and isopods feed on detritus. Typical background levels of selenium in small mammals are <1.0 - 4.0 mg/kg for whole body samples and 1.0 - 10.0 mg/kg for liver samples (USDI 1998). The mean selenium levels of body and liver samples from both deer mice and shrews are at the lower end of these ranges.
3. Management
a. Cover Crop Production
In 2001, barley was grown as a cover crop on the 80-acre parcel located along Manning Avenue and in a 40-acre parcel east of the study plots. The barley on both sites was harvested in June. In the winter of 2001-2002, the 80-acre parcel was planted with a restoration mix and the 40-acre parcel was used as a berm trial area, native plant nursery, and barley/seed mix strip trial area (see section III A 1).
b. Grazing
No managed grazing occurred on the LRDP Tranquillity site in 2001. However, trespass grazing did occur in the 160-acre restoration area that is located southeast of the HRS study blocks. The sheep owner had permission to graze sheep south of South Avenue from Westlands Water District and inadvertently encroached upon project lands. Temporary fencing was erected on the parcel and sheep were grazed for a total of 4 days from 8-11 October 2001. The level of grazing was intense enough to virtually denude the parcel of all vegetation. Fortunately, the native plants that germinated from the restoration effort had gone to seed and disarticulated prior to the grazing. Additionally, most of the shrub seedlings that were planted did not survive, although grazing did destroy the few seedlings that persisted. The sheep also trampled and destroyed the majority of the low berms that had been installed in the parcel. Monitoring of the site will occur in spring 2002 to determine if native annual plants remain on the site and to determine the effects of grazing on the non-native weeds (mostly Sisymbrium and Brassica ) that dominated the site.
c. Recreational Uses
The California Department of Fish and Game has annually planted approximately 60 acres of the Tranquillity site in safflower. The safflower field is used for an annual junior dove hunt in September. In 2001, 35 hunters harvested 213 dove during the hunt.
B. Atwell Island
1. Restoration Studies
a. Small Test Plots
During the Fall of 2001 USBLM established a series of 456, 1/1000-acre (6ft 7in x 6ft 7in) test plots in the southwest quarter of Section 23 (Figure 34). Seed from 29 species of shrubs, forbs, and grasses were planted in the plots. Four types of site preparation were used:
- scraping the surface;
- disking to 8 inches;
- harrowing to 4 inches; and
- no preparation.
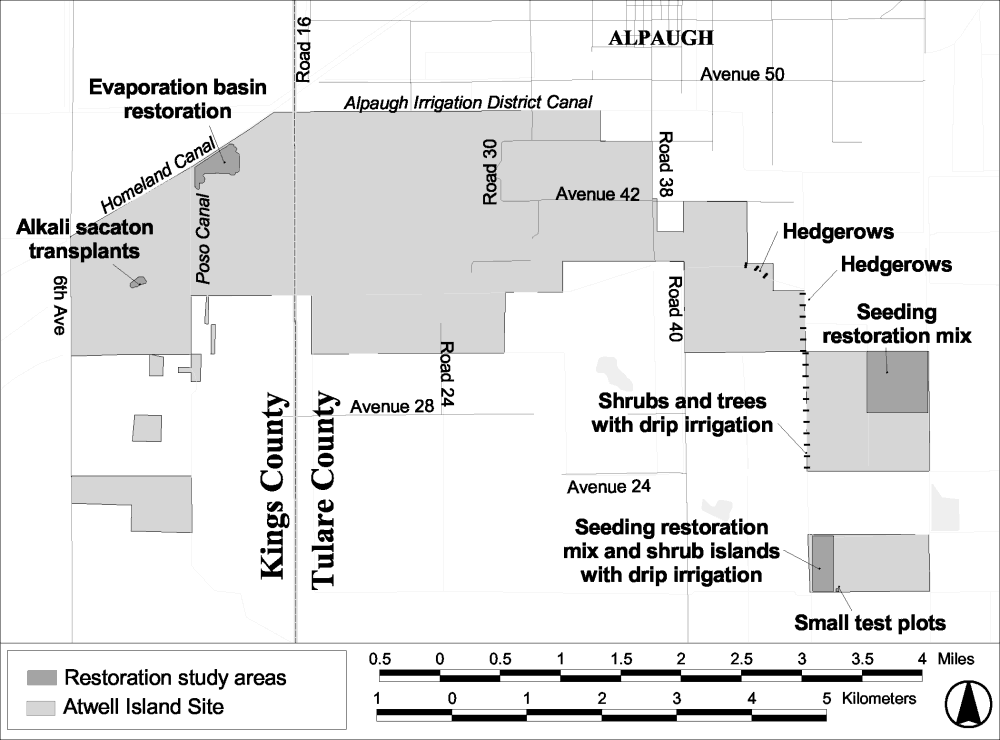
Figure 34.
Locations of restoration studies conducted at the Atwell Island
site.
A standard seeding rate of 40 pounds/acre was used on these plots for each site preparation. On the scraped area, in addition to the 40 pounds/acre seeding rate, plots with other seeding rates were established: 1) 10 pounds/acre, 2) 80 pounds/acre, and 3) 160 pounds/acre. On the disked area, plots with added nutrients were established. Bone meal was used to increase soil phosphorus content and blood meal was used to increase soil nitrogen content. Rates of 500 and 1,000 lbs/ac effectively doubled and tripled the available soil phosphorus and nitrogen in the soil. An additional treatment of 500 lbs/ac of both blood and bone meal was used.
These test plots are being used as a screening technique to look for broad effects and are the first step of a tiered approach. This year's work will be used to search for interesting trends and to help focus future, more in-depth, research. In the second year, if promising species or trends have emerged, USBLM will set up more in-depth trials involving those species and treatments. In this second stage an experimental approach with replicates will be used.
Plots will be monitored by USBLM during the spring of 2002 and in succeeding years. Additional plots will be established in fall of 2002 to look at various weed competition factors and several seed mixes.
b. Hedgerows
During February of 2001, six 0.25-mile long hedgerows were planted in the northeast quarter of Section 10 (Figure 34). This was done using a Rhino plow to dig the ditches and then a Truax range drill to seed over the ditches with a commercial hedgerow mix (60% bran and 40% native seed). The seed mix contained 29% quail bush ( Atriplex lentiformis ), 22% creeping wildrye ( Leymus triticoides ), 14% few-flowered fescue ( Vulpia microstachys ), 14% fiddleneck ( Amsinkia menziesii ), 7% common sunflower ( Helianthus annus ), 7% alkali heath ( Frankenia salina ), 4% turkey mullein ( Eremocarpus setigerus ), 1% bluedicks ( Dichelostemma capitatum ), and 1% spikeweed ( Hemizonia pungens ). The ditches were watered twice, once in May and once in July.
These hedgerows were very successful, with good coverage of sunflower and excellent growth and establishment of quail bush, many of which reached 1.0 m in height by February 2002. As a result of this success, we will establish an additional 38, 0.5-mile long hedgerows in the south east quarter of Section 10 (Figure 34) in 2002. These will be planted in two configurations; a series of four ditches 6 ft apart and single wavy line ditches. Six hedgerows will be seeded with the commercial mix and the remaining ditches will be seeded with a combination of wild-collected quail bush (25%), valley salt bush (25%), sunflower (35%), and alkali sacaton (15%) at a rate of approximately 30 pounds per acre. These hedgerows will be watered two or three times during the season, starting in early March 2002. Approximately 20 acres of this 160 acre quarter section will be planted, but the hedgerows are spread throughout the quarter section.
c. Seeding Restoration Mix
The USBLM seeded a total of 160 acres with restoration mix in January 2001 using a Truax range drill (Figure 34). Only moderate germination was observed, probably due to the lack of spring rain. This site will be monitored in spring 2002.
In late November 2001, 80 acres in Section 23 were seeded. Forty acres were seeded with the restoration mix at approximately 30 pounds/acre and 40 acres with local wild-collected spikeweed seed. The commercial restoration mix was purchased from S&S Seed Company and consisted of 7% Eremocarpus setigerus , 3% Sporobolus airoides , 2% Frankenia salina , 0.3% Hemizonia pungens , 1.5% Lasthenia californica , 9% Atriplex polycarpa , 9% Atriplex spinifera , 3% Vulpia microstachys , 3% Gilia tricolor diffusa , 3% Suaeda moquinii , 3% Isocoma acradenia , and 56% bran. The restoration mix was seeded at a rate of 11.1 pounds of seed/acre. All except four seeding passes were made with the imprinter. The range drill was used on four passes, but was discontinued because the soil was too moist causing the planter to clog. As of mid-February 2002, germination of these plantings has been excellent. The range-drilled areas appear to have better germination than the imprinted areas, primarily because the range drill did a better job at clearing residual vegetation from the soil.
In three areas, approximately 30 by 90 ft in extent, residual and green vegetation was burned off using a hand-held propane torch immediately prior to planting. An inspection in early February 2002 showed germination similar to that of the non-burned areas. By late February 2002, survival and growth of seedlings was much higher on the burned areas than on non-burned plots. Native species observed were Vulpia sp., Gilia sp., Lasthenia sp.(included in seed mix), and California Mustard ( Guillenia lasiophylla ; not in the seed mix).
d. Shrubs and Trees with Drip Irrigation
Approximately 150 cuttings (rooted in supercells-10 in deep plastic containers) of native trees and shrubs were planted along the Alpaugh Irrigation District Canal in Section 14 (Figure 34). Drip irrigation was installed and the plantings were watered with a small portable pump, with the water pumped from the canal. Quail Bush shrubs had high survival and good growth rates, reaching 3 ft in height. The cottonwoods and Baccharis salicifolia plantings had zero survival, primarily because of a grasshopper plague in mid-summer. The grasshoppers ate the leaves and the bark of the trees and shrubs. It is likely that this was an aberrant situation and the planting will be re-tried in 2002.
Additional plantings with 8-ft-long poles will be done along the canal in Section 10 using a hydraulic auger in March 2002. This method places the rooting zone of the plant in ground water seepage from the canal, thus avoiding the need for drip irrigation.
e. Shrub Islands with Drip Irrigation
During fall 2001, a drip irrigation system to help establish shrub islands was placed on the 80 acres that were planted with the range drill in Section 23 (Figure 34). Twelve lines, each 1,000 ft long with a total of 1,400 emitters, were installed. The purpose of this irrigation system is to provide supplemental water to help increase survival of shrubs through their first growing season. Seedlings were planted at approximately 300 emitters, while at the other 1,100 emitters seeds were planted. Seedlings were primarily Atriplex polycarpa , Isocoma acradenia , and Sporobolus airoides , with some Atriplex lentiformis . Seed was composed of both native and commercial Atriplex polycarpa and Atriplex lentiformis .
f. Alkali Sacaton Transplants
A patch of 266 alkali sacaton ( Sporobolus airoides ) seedlings was planted along sand ridge in Section 11 in mid-January 2002 (Figure 34). These plants will be watered during the first growing season.
g. Evaporation Basin Restoration
The Evaporation Basin-an approximately 33-acre former evaporation basin located along the western edge of the Atwell Island LRDP property (Figure 34)-was targeted for a cursory restoration trial in late 2001. The evaporation basin is characterized by a flat expanse of highly alkaline, salt-encrusted soil, nearly devoid of vegetation; however, adjacent lands, which are managed by the USBLM, support fair-sized populations of native alkali sink vegetation. The Evaporation Basin was in intermittent closure in 1999, and has had no discharges from tile drains since 1994. Selenium levels were tested in 1994 and were found to be below the detection limit (Interagency Land Retirement Team 1999).
Restoration efforts conducted by ESRP occurred during November and December 2001. Only outer edges of the evaporation basin were accessible, as rainfall at that time had created extremely wet and muddy conditions. Vegetation was introduced to the site by both seeding and transplanting. Areas to be seeded were prepared by loosening the soil with rakes. Native seed from adjacent properties was collected and then broadcast onto the raked seedbeds. Species planted in this manner were: Allenrolfea occidentalis , Distichlis spicata , Frankenia salina , Heliotropium curassavicum , and Suaeda moquinii . Two of these, Distichlis spicata and Allenrolfea occidentalis , also were introduced to the site through transplanting. Rhizomes of D. spicata that were growing along the perimeter and encroaching onto the salt flat were transplanted onto the restoration area. Plugs of Allenrolfea occidentalis were grown by the Southern California Edison Nursery (Auberry) from native seed collected from the Tranquillity area, and were transplanted directly onto the site. At this time, there are no plans to conduct quantitative sampling at the site; rather, the success of the restoration will be monitored non-systematically. Additional planting efforts will be conducted in the evaporation basin as time and resources permit.
h. Native Seed Collection
During 2001 USBLM contracted with four seed collectors to collect native seed in the southern San Joaquin Valley. The spring collection in the Goose Lake area netted 90 pounds of goldfields ( Lasthenia californica ) seed, 0.5 pounds of few-flowered fescue ( Vulpia microstachys ) seed, and 1.5 pounds of slender-hair grass ( Deschampsia danthonioides ) seed. The early fall seed collections yielded 202 pounds of bush seepweed ( Suaeda moquinii ), 778 pounds of spiny saltbush ( Atriplex spinifera ), 78 pounds of alkali heath ( Frankenia salina ), 379 pounds of spikeweed ( Hemizonia pungens ), 1 pound of alkali sacaton ( Sporobolus airoides ), 124 pounds of alkali mallow ( Malvella leprosa ), 3.2 pounds of alkali heliotrope ( Heliotropium curassavicum ), 1 pound of slender-leaf milkweed ( Asclepias fascicularis ), 277 pounds of common sunflower ( Helianthus annuus ), and 5 pounds of goldenbush ( Isocoma acradenia ). The late fall seed collecting yielded 404 pounds of valley saltbush ( Atriplex polycarpa ) and 148 pounds of quail bush ( Atriplex lentiformis ). The weights given above are for cleaned seed, but some chaff and seed husks are included (the amount varies by species).
Nearby natural areas that will serve as reference and seed source sites for restoration efforts include Kern National Wildlife Refuge, Pixley National Wildlife Refuge, Allensworth State Ecological Reserve, and other southern San Joaquin Valley sites managed by California Department of Fish and Game and the Center for Natural Lands Management.
2. Biological Monitoring
ESRP conducted monitoring on a site-wide basis in 2001, which was not directly related to the Atwell Island Habitat Restoration Study. Monitoring consisted of:
- spotlighting surveys;
- track station surveys;
- winter raptor surveys;
- contaminants sampling (vegetation, invertebrates, and small mammals).
Locations of these sampling activities is presented in Figure 35. Additionally, USBLM conducted a winter bird count and constructed a database to record incidental wildlife observations.
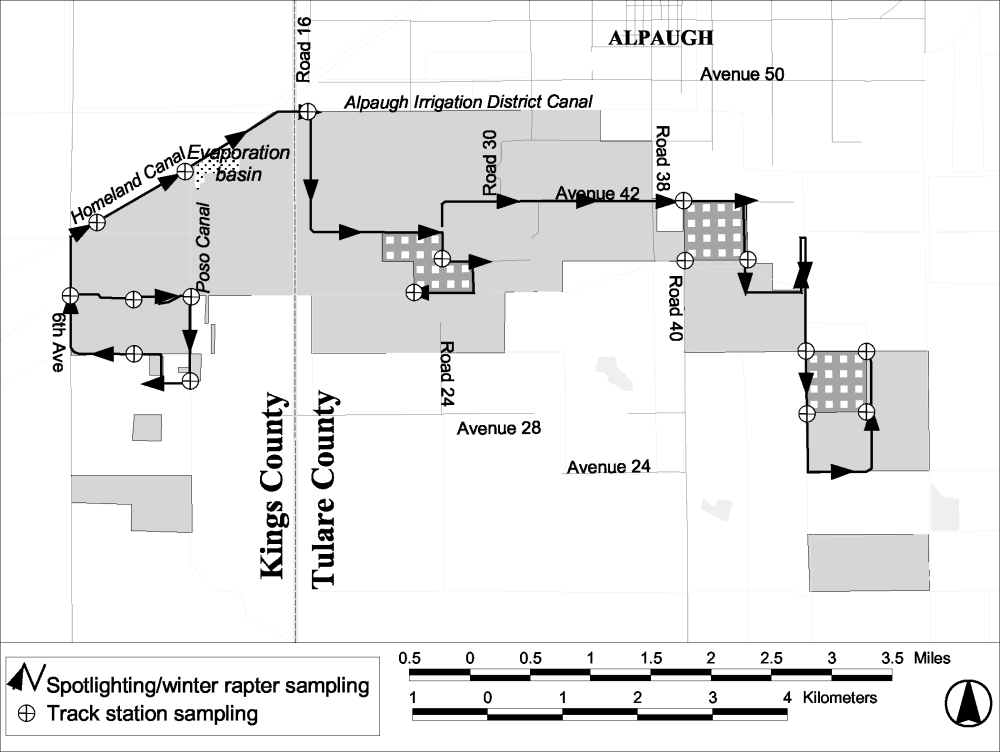
Figure 35.
Sampling locations for site-wide biological monitoring at the
Atwell Island site.
a. Spotlighting Surveys
i. Methods
Spotlighting surveys of the Atwell Island site were conducted on 17-19 September and 10-12 December following methods that have been previously presented (Uptain et al. 2001).
ii. Results
The most commonly observed species during September spotlighting were barn owls, kangaroo rats, western toads, and desert cottontails (Table 40). During December spotlighting, the most common species observed were desert cottontails, barn owls, black-crowned night herons ( Nycticorax nycticorax ), black-tailed jackrabbits, and great egrets ( Ardea alba ). The number of species observed in September (18) was greater than the number observed in December (15) and there were differences in species composition.
Table 40. Frequency and rate of animals observed during spotlighting surveys at the Atwell Island site, 2001.
|
Taxon |
Fall 2001 |
Winter 2001 |
||
|---|---|---|---|---|
|
Frequency 1 |
Rate 2 |
Frequency 1 |
Rate 2 |
|
|
bats |
66.7 |
0.08 |
0 |
0 |
|
black-crowned night heron |
66.7 |
0.14 |
66.7 |
0.21 |
|
black-tailed hare |
100.0 |
0.12 |
66.7 |
0.21 |
|
burrowing owl |
66.7 |
0.05 |
100.0 |
0.12 |
|
carp |
33.3 |
0.02 |
0 |
0 |
|
cat |
0 |
0 |
33.3 |
0.02 |
|
coyote |
100.0 |
0.05 |
33.3 |
0.04 |
|
deer mouse |
33.3 |
0.04 |
0 |
0 |
|
desert cottontail |
100.0 |
0.16 |
100.0 |
0.46 |
|
dog |
66.7 |
0.05 |
33.3 |
0.07 |
|
great blue heron |
33.3 |
0.02 |
33.3 |
0.02 |
|
great egret |
66.7 |
0.04 |
100.0 |
0.20 |
|
kangaroo rat |
100.0 |
0.25 |
33.3 |
0.02 |
|
killdeer |
33.3 |
0.02 |
0 |
0 |
|
prairie falcon |
0 |
0 |
33.3 |
0.02 |
|
red-tailed hawk |
0 |
0 |
100.0 |
0.07 |
|
snowy egret |
0 |
0 |
66.7 |
0.11 |
|
western meadowlark |
100.0 |
0.09 |
100.0 |
0.21 |
|
||||
iii. Discussion
Rates of observation (an index of abundance), frequency of observation, and species composition are expected to differ seasonally. As expected, each of these indices decreased from September to December. As restoration efforts are expanded, we would expect increases in small mammals, birds, and predators on those species.
b. Track Station surveys
i. Methods
Track station surveys of the Atwell Island site were conducted on 18-20 September and 11-13 December following the methods presented previously (Uptain et al. 2001).
ii. Results
The greatest abundance of tracks and the greatest variety of species were observed during the September survey period. The most abundant tracks observed in September were of mice, insects, kangaroo rats, and toads. The most abundant tracks observed in December were of mice, birds, and dogs. The frequency and rate of visitation of invertebrates, amphibians, and reptiles were higher in fall than in winter (Table 41). Likewise, the rate of visitation (but not frequency) for birds and mammals was higher in the fall.
Table 41. Results of track station surveys at the Atwell Island site, 2001.
|
Taxon |
Fall 2001 |
Winter 2001 |
||
|---|---|---|---|---|
|
Frequency 1 |
Rate 2 |
Frequency 1 |
Rate 2 |
|
|
Invertebrates |
100.0 |
0.17 |
33.3 |
0.04 |
|
Amphibians |
100.0 |
0.13 |
0 |
0 |
|
Reptiles |
33.3 |
0.04 |
0 |
0 |
|
Birds |
100.0 |
0.11 |
100.0 |
0.09 |
|
Mammals |
100.0 |
0.30 |
100.0 |
0.13 |
|
Unknown |
0 |
0 |
66.7 |
0.04 |
|
||||
iii. Discussion
We expect that the variety of species and abundance of tracks at the track stations will increase as restoration efforts at the site proceed. Invertebrates, mice, birds, and carnivore visits are especially likely to increase.
c. Winter Raptor Survey
i. Methods
Winter raptor surveys of the Atwell Island site were conducted from 11-13 December 2001 and followed methods presented previously (Uptain et al. 2001).
ii. Results
Eight species of raptors, along with loggerhead shrikes, were documented on the winter raptor survey route (Table 42). Though technically a passerine species, loggerhead shrikes are considered to be an avian predator and are included in this census. The predominant raptors observed were red-tailed hawks and northern harriers (Table 42). American kestrels, white-tailed kites, and loggerhead shrikes were identified each of the three survey dates, but in lower numbers than the former two species. Prairie falcons ( Falco mexicanus ), and ferruginous hawks were observed intermittently throughout the census. A single red-shouldered hawk was detected on the first day of the census. Four species recorded on this census are considered species of special concern in California (CSC) or federal special concern species (FSC): loggerhead shrike (FSC, CSC), ferruginous hawk (FSC, CSC), prairie falcon (CSC), and northern harrier (CSC).
Table 42. Number of observations, frequency, and rate of wintering raptors at the Atwell Island site, 2001.
|
Species |
December |
Total 1 |
Frequency 2 |
Rate 3 |
|||
|---|---|---|---|---|---|---|---|
|
White-tailed Kite |
Elanus caeruleus |
2 |
4 |
3 |
9 |
100 |
0.14 |
|
Northern harrier |
Circus cyaneus |
12 |
13 |
12 |
37 |
100 |
0.56 |
|
Ferruginous Hawk |
Buteo regalis |
2 |
3 |
0 |
5 |
67 |
0.08 |
|
Loggerhead Shrike |
Lanius ludovicianus |
3 |
9 |
6 |
18 |
100 |
0.27 |
|
Unidentified |
2 |
2 |
2 |
6 |
100 |
0.09 |
|
|
Total number observed |
44 |
59 |
57 |
160 |
|
||
|
|||||||
iii. Discussion
American kestrels, northern harriers, and a single prairie falcon were observed foraging on, or adjacent to, the study plots. All three species are known to feed on small birds along with other prey items. Large flocks of horned larks, which were present on some of the study plots, may be providing a prey source for these three raptors. Red-tailed hawks, white-tailed kites, and northern harriers all were observed performing aerial displays over LRDP lands. White-tailed kites begin courtship behavior and nest building in December and January (Dunk 1995); hence, it is conceivable that these displays represented pair-bonding.
The red-shouldered hawk was an unexpected species considering the open habitat that occurs along the survey route. Red-shouldered hawks typically occur in riparian forests or oak woodlands (Kauffman 1996). This individual was flushed from an open, brushy area along the route that is not representative of its normal habitat. However, a narrow strip of marginal riparian habitat does exist within the vicinity that may support this individual.
The timing of this survey reflects the propensity of numerous raptor species to winter in this region. However, this census is not a complete representation of all raptors using LRDP lands. Species such as Swainson's hawk ( Buteo swainsoni ) may forage over the project site during the breeding season, but migrate south during the winter months. Thus, this species probably would be absent during the census.
d. Mid-winter Bird Count
An 8-hour bird count was conducted by USBLM personnel and volunteers on 26 December 2001. A total of 71 bird species were found during the day and 4,190 individual birds were recorded. The most common species were: red-winged blackbird (1,408), house finch (362), white-crowned sparrow (314), savannah sparrow (291), horned lark (184), and European starling (176). This count will be repeated yearly. In the future, two or three groups will be recruited to help with the count in order to get better coverage of the area.
e. Incidental Wildlife Sighting Database
Beginning in August 2001, USBLM started a database to keep track of incidental wildlife sightings. As of February 2002, 681 observations have been made, recording 102 species of birds, 5 species of mammals, 2 species of reptiles, and 5 species of butterflies on the Atwell Island Project Area. Noteworthy sightings include merlin, Swainson's hawk, prairie falcon, white-tailed kite, white pelican ( Pelecanus erythrorhynchos ), white-faced ibis ( Plegadis chihi ), Virginia rail ( Rallus limicola ), sandhill crane ( Grus canadensis ), redhead ( Aythya americana ), long-billed curlew ( Numenius americanus ), herring gull ( Larus argentatus ), yellow warbler ( Dendroica petechia ), chestnut-collared longspur ( Calcarius ornatus ), and coast horned lizard.
f. Contaminants Monitoring
i. Methods
Monitoring of selenium contamination of the Atwell Island site was conducted on 16 May (vegetation) and 12-13 June 2001 (invertebrates). Methods were previously presented (Uptain et al. 2001). Vegetation, invertebrate, and small mammal samples were collected from the locations shown in Figure 36. Sampling locations were classified as cultivated areas, uncultivated areas, and experimental areas. Samples were collected in both 2000 and 2001 to provide information on baseline conditions. For analysis, plants were grouped as selenium accumulators (those plant species known to accumulate selenium in their tissues), and non accumulators. Small mammal tissues that were collected in 2001 spoiled prior to being frozen in the lab. Therefore, a representation of baseline conditions of selenium contamination in small mammals at the Atwell Island site was derived solely from data collected in 2000 during the pre-project inventory (see Appendix A in Uptain et al. 2001). In previous reports (Selmon et al. 2000, Uptain et al. 2001), geometric means of contaminant samples were not calculated on a group of data whenever one or more samples within the group had a selenium level below the detection limit. In this report, when a sample contained less than the detection limit, the value for that sample was set at half of the detection limit and the geometric mean was calculated for the data group.
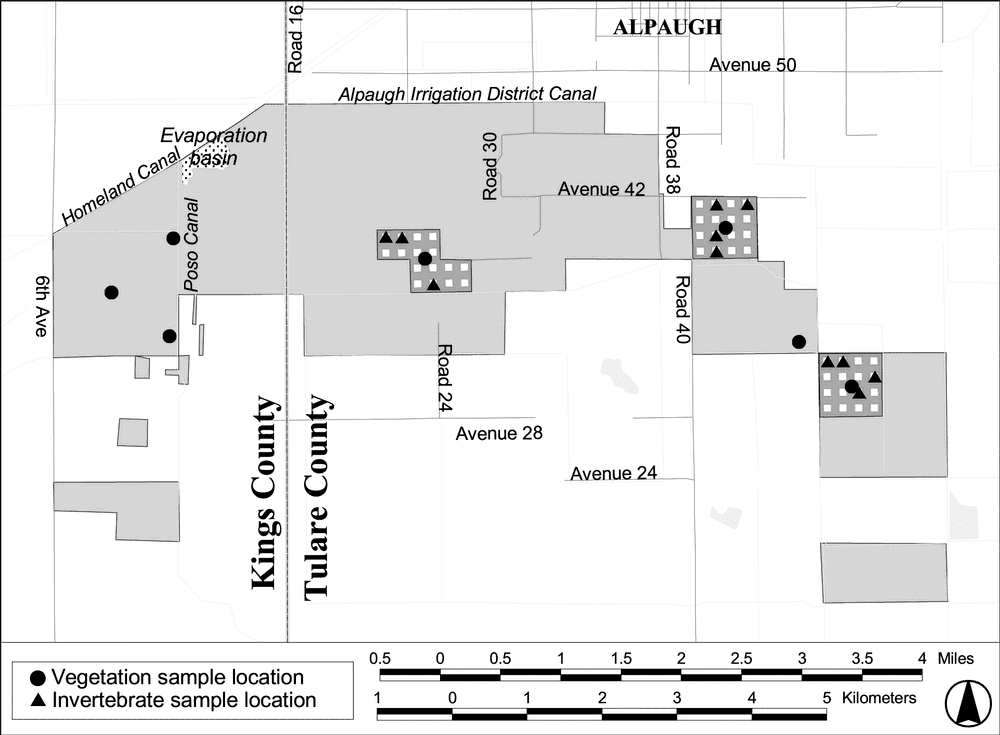
Figure 36.
Locations of selenium sampling at the Atwell Island site.
ii. Results
The geometric means of the samples collected for all taxa had selenium concentrations within the range of typical background levels (see Table 43, Table 44, Table 45 and section III A d iii of this report). Furthermore, all taxa exhibited trends of declining selenium levels between 2000 and 2001 (except small mammal data because no data were available for 2001).
Table 43. Selenium levels in samples of vegetation collected from the Atwell Island site during baseline surveys in 2000 and 2001.
|
Land use |
Taxon code |
Part |
2000 |
2001 |
||||||||
|---|---|---|---|---|---|---|---|---|---|---|---|---|
|
N |
Min |
Max |
Mean |
SE |
N |
Min |
Max |
Mean |
SE |
|||
|
Cultivated |
ATAR |
Veg |
|
|
|
|
|
3 |
0.1 |
0.1 |
0.1 |
0.000 |
|
HOMU |
Seeds |
|
|
|
|
|
3 |
0.1 |
0.1 |
0.1 |
0.000 |
|
|
HOVU |
Seeds |
|
|
|
|
|
3 |
0.1 |
0.1 |
0.1 |
0.000 |
|
|
Veg |
|
|
|
|
|
3 |
0.1 |
0.1 |
0.1 |
0.000 |
||
|
MEIN |
Veg |
|
|
|
|
|
3 |
0.1 |
0.1 |
0.1 |
0.000 |
|
|
Uncultivated |
ATAR |
Whole |
10 |
0.1 |
0.4 |
0.11 |
0.030 |
3 |
0.1 |
0.3 |
0.14 |
0.067 |
|
BRMA |
Seeds |
|
|
|
|
|
3 |
0.1 |
0.2 |
0.13 |
0.033 |
|
|
Veg |
1 |
0.1 |
0.1 |
0.1 |
0.000 |
|
|
|
|
|
||
|
BRNI |
Seeds |
5 |
0.1 |
0.1 |
0.1 |
0.000 |
|
|
|
|
|
|
|
Veg |
4 |
0.2 |
0.5 |
0.3 |
0.075 |
|
|
|
|
|
||
|
Whole |
1 |
0.1 |
0.1 |
0.1 |
0.000 |
|
|
|
|
|
||
|
CRTR |
Whole |
9 |
0.1 |
0.3 |
0.13 |
0.029 |
|
|
|
|
|
|
|
DISP |
Whole |
5 |
0.05 |
1.4 |
0.17 |
0.259 |
|
|
|
|
|
|
|
HECU |
Veg |
|
|
|
|
|
3 |
0.1 |
0.1 |
0.1 |
0.000 |
|
|
HEPU |
Veg |
|
|
|
|
|
3 |
0.1 |
0.2 |
0.13 |
0.033 |
|
|
Whole |
8 |
0.05 |
0.2 |
0.08 |
0.018 |
|
|
|
|
|
||
|
HOMU |
Seeds |
|
|
|
|
|
3 |
0.1 |
0.3 |
0.14 |
0.067 |
|
|
Whole |
10 |
0.05 |
0.1 |
0.09 |
0.005 |
|
|
|
|
|
||
|
MEIN |
Veg |
|
|
|
|
|
1 |
0.1 |
0.1 |
0.1 |
0.000 |
|
|
Whole |
10 |
0.05 |
0.15 |
0.09 |
0.009 |
|
|
|
|
|
||
|
SIIR |
Whole |
4 |
0.05 |
0.1 |
0.08 |
0.013 |
|
|
|
|
|
|
|
||||||||||||
Table 44. Selenium levels in samples of invertebrates collected from the Atwell Island site during baseline surveys in 2000 and 2001.
|
Land use |
Taxon group |
Part |
2000 |
2001 |
||||||||
|---|---|---|---|---|---|---|---|---|---|---|---|---|
|
N |
Min |
Max |
mean |
SE |
N |
Min |
Max |
mean |
SE |
|||
|
Uncultivated |
Beetles |
Body |
8 |
0.04 |
0.4 |
0.13 |
0.051 |
|||||
|
Crickets |
Body |
|
|
|
|
|
9 |
0.1 |
0.45 |
0.18 |
0.037 |
|
|
Isopods |
Body |
|
|
|
|
|
9 |
0.07 |
0.6 |
0.33 |
0.067 |
|
|
Spiders |
Body |
|
|
|
|
|
9 |
0.29 |
1 |
0.55 |
0.075 |
|
|
Experimental |
Beetles |
Body |
10 |
0.1 |
1 |
0.49 |
0.125 |
|||||
|
Crickets |
Body |
3 |
0.2 |
1 |
0.39 |
0.252 |
|
|
|
|
|
|
|
Isopods |
Body |
12 |
0.1 |
1.5 |
0.38 |
0.104 |
|
|
|
|
|
|
|
Spiders |
Body |
11 |
0.35 |
2.5 |
0.81 |
0.227 |
|
|
|
|
|
|
Table 45. Selenium levels in samples of small mammals collected from the Atwell Island site during baseline surveys in 2000 and 2001.
|
Land use |
Taxon group |
Part |
2000 |
||||
|---|---|---|---|---|---|---|---|
|
N |
Min |
Max |
mean |
SE |
|||
|
Uncultivated |
Peromyscus maniculatus
|
Body |
10 |
0.5 |
0.82 |
0.68 |
0.034 |
|
Liver |
10 |
1.9 |
3.4 |
2.37 |
0.151 |
||
iii. Discussion
Data for the Atwell Island site will be collected in 2002 and compared to the baseline data presented here. It is expected that selenium levels will continue to decline, as has occurred on the Tranquillity site.
3. Management
a. Controlled Burning
The USBLM completed an Environmental Assessment (USBLM 2001) for controlled burning on the project area. A controlled burn was conducted by a USBLM fire crew along a canal on the south side of Section 23 in mid-November 2001.
b. Game Bird Heritage Program Dove Hunt
During the summer of 2001, safflower was planted on 60 acres and barley was planted on 10 acres of Section 10 (see Figure 34). This was a cooperative project between USBLM and California Department of Fish and Game, with USBLM furnishing the water and labor and CDFG purchasing the seed. The safflower was grown with approximately 0.5 acre-feet of water applied in pre-planting irrigation. The lack of spring rain was responsible for poor seed production of the safflower. The plants grew to normal size and produced abundant seed heads, but most heads had only one or two seeds and most seeds were "blanks" (i.e. only the shell had formed and there was no seed inside). The hunt was conducted on opening day of dove hunting season in early September. Twenty seven hunters attended the hunt and harvested only 13 doves. This cooperative project will be repeated during 2002, but the site will be moved to a location with better soil and closer to roosting sites along the Alpaugh Irrigation District Canal in Section 5.