Endangered Species Recovery Program | |
|
Home | News | Publications | Species profiles | Data and maps | About | Staff | Links | Department of Biological Sciences | CSU Stanislaus | |
II. HABITAT RESTORATION STUDY
A. Tranquillity
1. Study Design
An 800 acre Habitat Restoration Study (HRS) was established at the Tranquillity site in 1999 to examine specific techniques of restoring natural habitat. Data are being collected and analyzed to assess differences between four experimental treatments: restoration using imprinting with native seeds in combination with surface contouring (installation of microtopography, CR); restoration using imprinting with native seeds (NR); surface contouring (CR); and no treatment (NN, Figure 4).
Specific objectives of the HRS are:
- to determine the efficacy of revegetation with native plants as a means to facilitate upland habitat restoration;
- to determine the efficacy of microtopographic contouring as a means to facilitate upland habitat restoration;
- to examine the responses of plants and wildlife to habitat changes.
In 1999, 20 10-acre study plots were randomly established within 5 blocks (Figure 4). Each plot is surrounded by 30 acres that have been maintained with a barley cover crop to isolate the plots, and to reduce weeds and the occurrence of soil erosion. An average of 4.6 inches of water was applied to the barley using a hand-moved sprinkler irrigation system in 12-hour sets during the time period from 15 March to 30 April 2001. Barley was harvested in June 2001. Previous reports (Selmon et al. 1999, Selmon et al. 2000, and Uptain et al. 2001) describe the installation of the microtopographic contours, methods of seeding and seedling transplanting, rates of seeding, and the composition of the seed mix. Supplemental planting or contouring did not occur on the study plots in 2001.
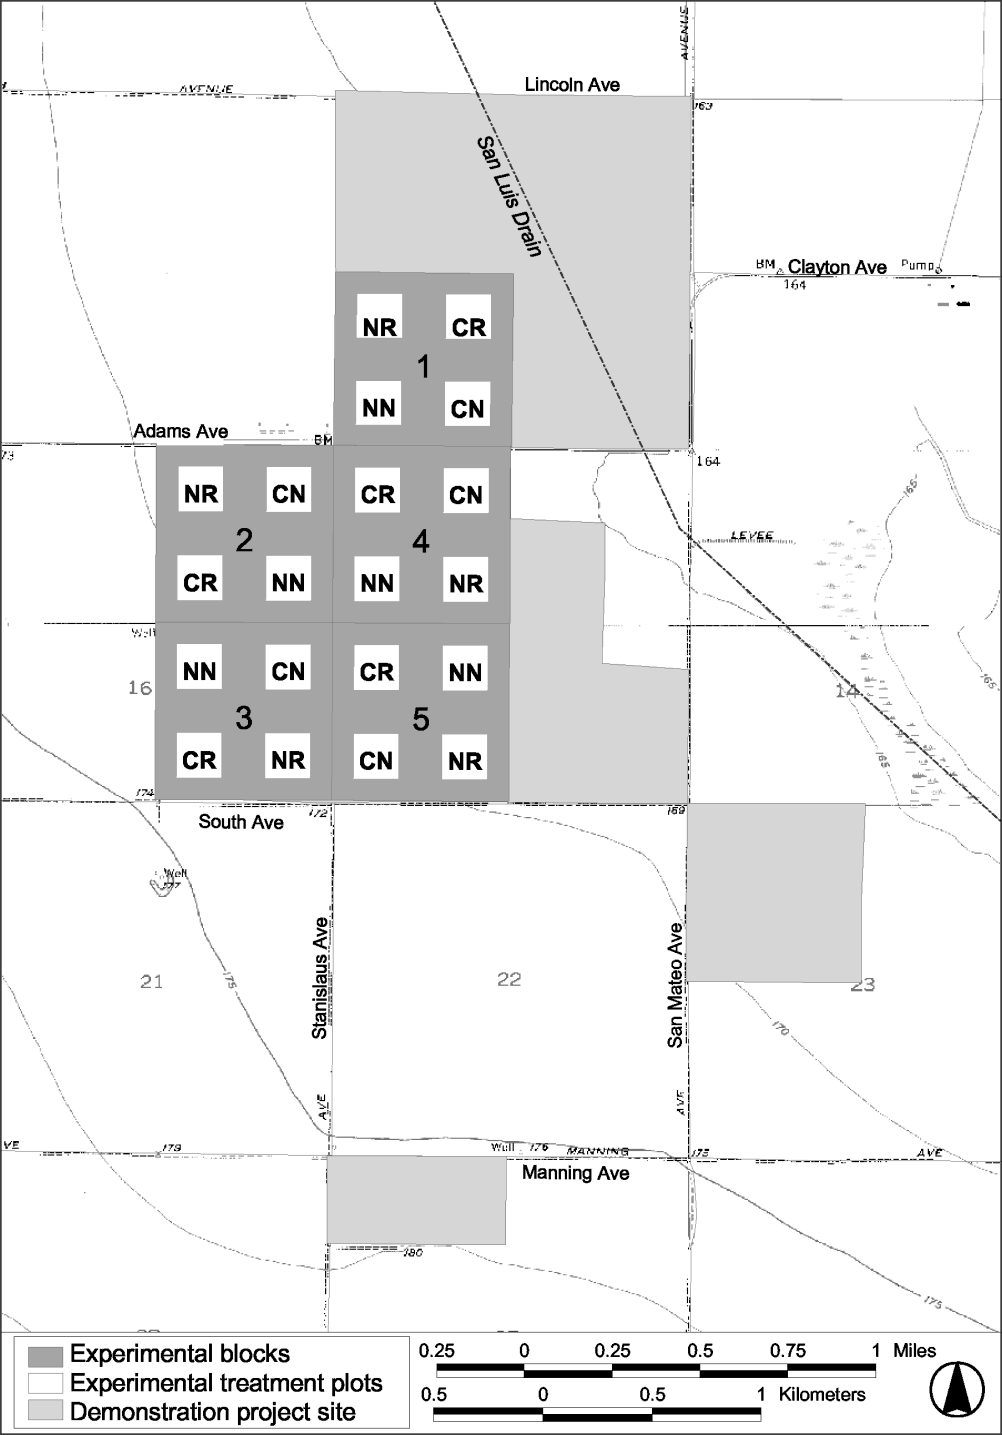
Figure 4.
Map of the Tranquillity site showing the randomized block
design and treatments applied to each study plot. CR =
contoured and restored, NR = not contoured but restored, CN =
contoured but not restored, NN = not contoured and not restored
(control).
2. Biological Monitoring
Biological monitoring conducted on the Tranquillity HRS plots in the year 2001 consisted of:
- annual vegetation surveys (richness and composition)
- annual invertebrate surveys (sweep and pitfall)
- annual amphibian and reptile surveys
- quarterly avian surveys
- quarterly small mammal surveys
a. Vegetation Surveys
i. Methods
Vegetation surveys were conducted on the Tranquillity HRS plots in May, 2001 (3-4, 9 May). Twenty four vegetation samples (35 cm by 70 cm rectangular quadrats) were taken from each plot. A stratified random sampling approach was employed, with plots divided into sixth-sections and four sampling points randomly selected within each section. All species were noted, and the percent cover contributed by each species was estimated using a modified Daubenmire cover scale (Bonham 1989). Total percent cover of all vegetation within the quadrat was also estimated using the same cover scale. When identification to species level was not possible, species were assigned morpho-species names (e.g., "unknown Atriplex ", "unknown with red cotyledons"). Plant productivity samples were not collected and will not be collected again until the last year of sampling, according to defined protocols.
Both digital and panoramic 35 mm photographs were taken on the experimental plots on (4 Sep, 21, 24 Dec 2001). Copies of the photos are archived at ESRP and USBR offices in Fresno and will be used to document temporal changes in plot vegetation.
Data were analyzed and presented differently in 2001 compared to 1999 and 2000. Accordingly, the information in this report supercedes those presented in previous annual reports (Selmon et al. 2000, Uptain et al. 2001). Descriptive statistics, Student's t -tests, and Analysis of Variance (ANOVA) were performed using the software package STATISTICA (StatSoft, Inc. 1999). In order to simultaneously express floristic relationships among the Tranquillity study plots and to examine the relationship between site vegetation and block effect, data were organized into a binary matrix of plots versus species (recorded as percent cover values) and were ordinated using Detrended Correspondence Analysis (DCA, Hill and Gauch 1980). Ordinations were conducted using the software package PC-Ord (McCune and Mefford 1997).
ii. Results
Twenty six species of vascular plants were observed on the Tranquillity HRS plots during vegetation sampling in 2001 (Appendix A, Table A1). In contrast, 21 species had been noted in the plots during 1999 sampling, and 31 species in 2000 (Appendix A, Table A1). Twelve of the species noted on the plots in 2000 were not noted in 2001; conversely, seven species noted during vegetation sampling in 2001 were not recorded for 2000 (Appendix A, Table A1). The sole species that was noted during vegetation sampling in 1999 and not noted in subsequent years was Sonchus asper (spiny sowthistle), an introduced species (Appendix A, Table A1). This species is easily confused with another common weed, Sonchus oleraceus (common sowthistle); hence, its omission in subsequent years most likely represents a sampling artifact.
Nine of the 26 species noted on the plots during 2001 vegetation sampling were native (Table 1). Six of these, Bromus carinatus , Hemizonia pungens , Lasthenia californica, Leymus triticoides , Suaeda moquinii , and Vulpia microstachys , were species that had been imprinted. Three of the seven species noted in 2001, which were not found in 2000, were native ( Amsinckia menziesii , H. pungens, and L. triticoides ; Table A1). However, none of these were noted in any great abundance, with L. triticoides present in seven quadrats, and H. pungens and Amsinckia menziesii each noted in a single quadrat (Appendix A, Table A2). In contrast, 8 of the 12 species that were noted in 2000 but not in 2001 were native (Table 1). Of these, two ( Frankenia salina and Isocoma acradenia ; Table 1) are species that were imprinted. At least one of these perceived absences ( Isocoma acradenia ) was clearly an artifact of sampling as mature individuals of this species, which is a fairly robust shrub, were noted on at least one plot later in the year (Fall, 2001).
Table 1. Seeded species and additional native species observed on the study plots at the Tranquillity HRS site. Species marked with an asterisk are those included in the seed mix.
|
Species |
Common name |
1999 |
2000 |
2001 |
|---|---|---|---|---|
|
Allenrolfea occidentalis * |
Iodine bush |
- |
- |
- |
|
Amsinckia menziesii |
rancher's fireweed |
- |
- |
+ |
|
Asclepias fascicularis |
narrow-leaved milkweed |
- |
+ 1 |
- |
|
Atriplex argentea |
silver scale |
+ |
+ |
+ |
|
Atriplex polycarpa * |
valley saltbush |
- |
- |
- |
|
Atriplex spinifera * |
spiny saltbush |
- |
- |
- |
|
Bromus carinatus * |
California brome |
- |
+ |
+ |
|
Eremalche parryi |
Parry's mallow |
+ |
+ |
- |
|
Frankenia salina * |
alkali heath |
- |
+ |
- |
|
Heliotropium curassavicum * |
heliotrope |
- |
- |
- |
|
Hemizonia pungens * |
common spikeweed |
- |
- |
+ |
|
Hordeum depressum |
alkali barley |
+ |
+ |
- |
|
Isocoma acradenia * |
goldenbush |
- |
+ |
- |
|
Lasthenia californica * |
goldfields |
- |
+ |
+ |
|
Leymus triticoides * |
creeping wildrye |
- |
- |
+ |
|
Malvella leprosa |
Alkali mallow |
- |
+ |
- |
|
Monolepis nuttalliana |
Nuttall's povertyweed |
- |
+ |
- |
|
Phacelia distans |
common phacelia |
+ |
+ |
+ |
|
Solanum americanum |
common nightshade |
- |
+ |
- |
|
Sporobolus airoides * |
alkali sacaton |
- |
- |
- |
|
Suaeda moquinii * |
bush seepweed |
- |
+ |
+ |
|
Vulpia microstachys * |
Nuttall's fescue |
- |
+ |
+ |
|
||||
By all measures, introduced (i.e., non-native) species were far more prevalent than native species in the Tranquillity HRS plots. When considered in terms of frequency (i.e., the number of samples in which a species was noted), introduced species were nearly 11 times more abundant than native species (Appendix A, Table A2). When considering only the imprinted plots (i.e., those plots that would be expected to have the largest component of native species), introduced species were still more than seven times as abundant as native species (Table 2). Nearly half of these were attributable to Atriplex argentea -a non-imprinted native of decidedly questionable value-thus, the number of desirable native species noted in the plots comprised about 8% of all species occurrences.
Table 2. Frequency of species noted in the imprinted plots during vegetation sampling, 2001. Species marked with an asterisk are those included in the seed mix.
|
Species |
Origin |
Plot 1 |
Quadrat 2 |
|---|---|---|---|
|
Atriplex argentea |
Native |
7 |
39 |
|
Avena fatua |
Introduced |
5 |
17 |
|
Beta vulgaris |
Introduced |
2 |
12 |
|
Brassica nigra |
Introduced |
6 |
39 |
|
Bromus carinatus * |
Native |
2 |
2 |
|
Bromus diandrus |
Introduced |
2 |
2 |
|
Bromus madritensis |
Introduced |
4 |
47 |
|
Capsella bursa-pastoris |
Introduced |
6 |
49 |
|
Erodium cicutarium |
Introduced |
2 |
14 |
|
Hemizonia pungens * |
Native |
1 |
1 |
|
Hordeum murinum |
Introduced |
5 |
48 |
|
Hordeum vulgare |
Introduced |
9 |
81 |
|
Lactuca serriola |
Introduced |
8 |
39 |
|
Lasthenia californica * |
Native |
6 |
15 |
|
Leymus triticoides * |
Native |
4 |
7 |
|
Melilotus indica |
Introduced |
6 |
46 |
|
Phacelia distans |
Introduced |
1 |
5 |
|
Phalaris sp. |
Introduced |
2 |
5 |
|
Salsola tragus |
Introduced |
2 |
7 |
|
Sisymbrium irio |
Introduced |
8 |
138 |
|
Sonchus oleraceus |
Introduced |
7 |
25 |
|
Suaeda moquinii * |
Native |
2 |
2 |
|
Vulpia microstachys * |
Native |
4 |
18 |
|
Summed quadrat frequency of introduced species: |
569 |
||
|
Summed quadrat frequency of native species: |
89 |
||
|
|||
When analyzed with respect to the contribution of the species classes to percent cover (Table 3; Table A3), the dominance of introduced species was more evident. Mean percent cover of imprinted species ranged from 0.00-1.73% (Table 3). In contrast, mean percent cover of introduced species ranged from 3.35-78.56%. In both cases, the lowest percent cover values were from the same plot (Plot 13). This plot was characterized by an abundance of last year's Atriplex argentea "skeletons" (the persistent stems and marcescent leaves). These stems tend to limit the germination of other species. This limiting effect of A. argentea on other plants can be clearly seen in Plot 13, in which 17 of the 24 quadrats were without living vegetation. Many of these samples were noted as having 50-95% of the quadrat area taken up by the dead A. argentea from the previous year. Generally, non-imprinted plots supported a higher percent cover of vegetation than did imprinted plots (Table 3). The differences in mean percent cover were found to be statistically significant, both between the non-seeded and imprinted treatments (ANOVA F = 6.408; p = 0.034) and among the five blocks (F = 6.408, p = 0.008).
Table 3. Overview of species grouped by origin at Tranquillity HRS. Values in the cell represent the estimated site-wide mean percent cover (calculated from the summed cover data divided by the total number of quadrats). Roman numerals indicate the block in which the plot was situated, followed by the number of the plot (in parentheses).
|
Origin |
Contoured/Imprinted |
Non-contoured/Imprinted |
||||||||
|---|---|---|---|---|---|---|---|---|---|---|
|
I |
II |
III |
IV |
V |
I |
II |
III |
IV |
V |
|
|
(2) |
(7) |
(11) |
(13) |
(17) |
(1) |
(5) |
(12) |
(16) |
(20) |
|
|
Imprinted |
0.02 |
1.73 |
0.06 |
0.00 |
0.00 |
0.08 |
0.98 |
0.33 |
0.17 |
0.00 |
|
Native |
1.71 |
0.00 |
18.90 |
0.15 |
0.02 |
1.54 |
0.00 |
3.23 |
6.29 |
0.00 |
|
Introduced |
30.23 |
15.00 |
15.90 |
3.35 |
36.06 |
54.10 |
22.23 |
17.02 |
17.71 |
25.00 |
|
Cultivar |
0.56 |
16.31 |
1.94 |
0.02 |
0.15 |
0.19 |
13.58 |
4.48 |
0.81 |
0.00 |
|
Not Identifiable |
0.08 |
0.00 |
0.00 |
0.00 |
0.00 |
0.02 |
0.00 |
0.00 |
0.00 |
0.0 |
|
Total: |
32.60 |
33.04 |
36.79 |
3.52 |
36.23 |
55.94 |
36.79 |
25.06 |
24.98 |
25.00 |
|
|
||||||||||
|
Origin |
Contoured/Non-Imprinted |
Non-contoured/Non-Imprinted |
||||||||
|
I |
II |
III |
IV |
V |
I |
II |
III |
IV |
V |
|
|
(4) |
(6) |
(10) |
(14) |
(19) |
(3) |
(8) |
(9) |
(15) |
(18) |
|
|
Imprinted |
0.00 |
0.00 |
0.00 |
0.00 |
0.00 |
0.00 |
0.00 |
0.00 |
0.00 |
0.00 |
|
Native |
0.13 |
0.00 |
0.25 |
0.63 |
0.00 |
0.13 |
0.02 |
3.56 |
4.29 |
0.02 |
|
Introduced |
60.21 |
20.63 |
15.77 |
22.35 |
67.73 |
78.56 |
24.40 |
38.88 |
15.17 |
54.25 |
|
Cultivar |
0.19 |
6.46 |
6.19 |
0.15 |
0.00 |
0.56 |
17.60 |
1.31 |
0.15 |
0.00 |
|
Not Identifiable |
0.13 |
0.00 |
0.00 |
0.00 |
0.00 |
0.00 |
0.02 |
0.00 |
0.00 |
0.13 |
|
Total: |
60.65 |
27.08 |
22.21 |
23.13 |
67.73 |
79.25 |
42.04 |
43.75 |
19.60 |
54.40 |
The effects of variability throughout the study area (i.e., "block effect") can be clearly seen in the ordinations of the vegetation data (Figure 5). Plots situated in close proximity in ordination space possess stronger floristic similarities than those situated further apart. If treatment effects were predominant, it would be expected that plots with the same color would be grouped in ordination space (i.e., the two dimensional frame in which the data are plotted). In contrast, if block effects were predominant, it would be expected that plots with the same shape would be grouped. In the first year of vegetation sampling (Figure 5), the majority of the study plots were situated in close proximity. This was not unexpected as the study plots (which had not yet been imprinted) were dominated by barley. In subsequent years, the plots diverged substantially from their initial positions (Figure 5). The most evident pattern in the two years following imprinting is a tendency for plots within the same block to be closely situated in ordination space (Figure 5). Clearly, the orientation of the plots was influenced to a great degree by physical differences among the blocks. Another noteworthy pattern was the orientation of plots in blocks 1 and 5. These were grouped closely by block, with each group constituting one of the endpoints for Axis 1 (Figure 5). These spatial relationships suggest that blocks 1 and 5 were the most dissimilar, and that treatment effects were minimal in these two blocks relative to the effects of other factors (e.g., weed load).
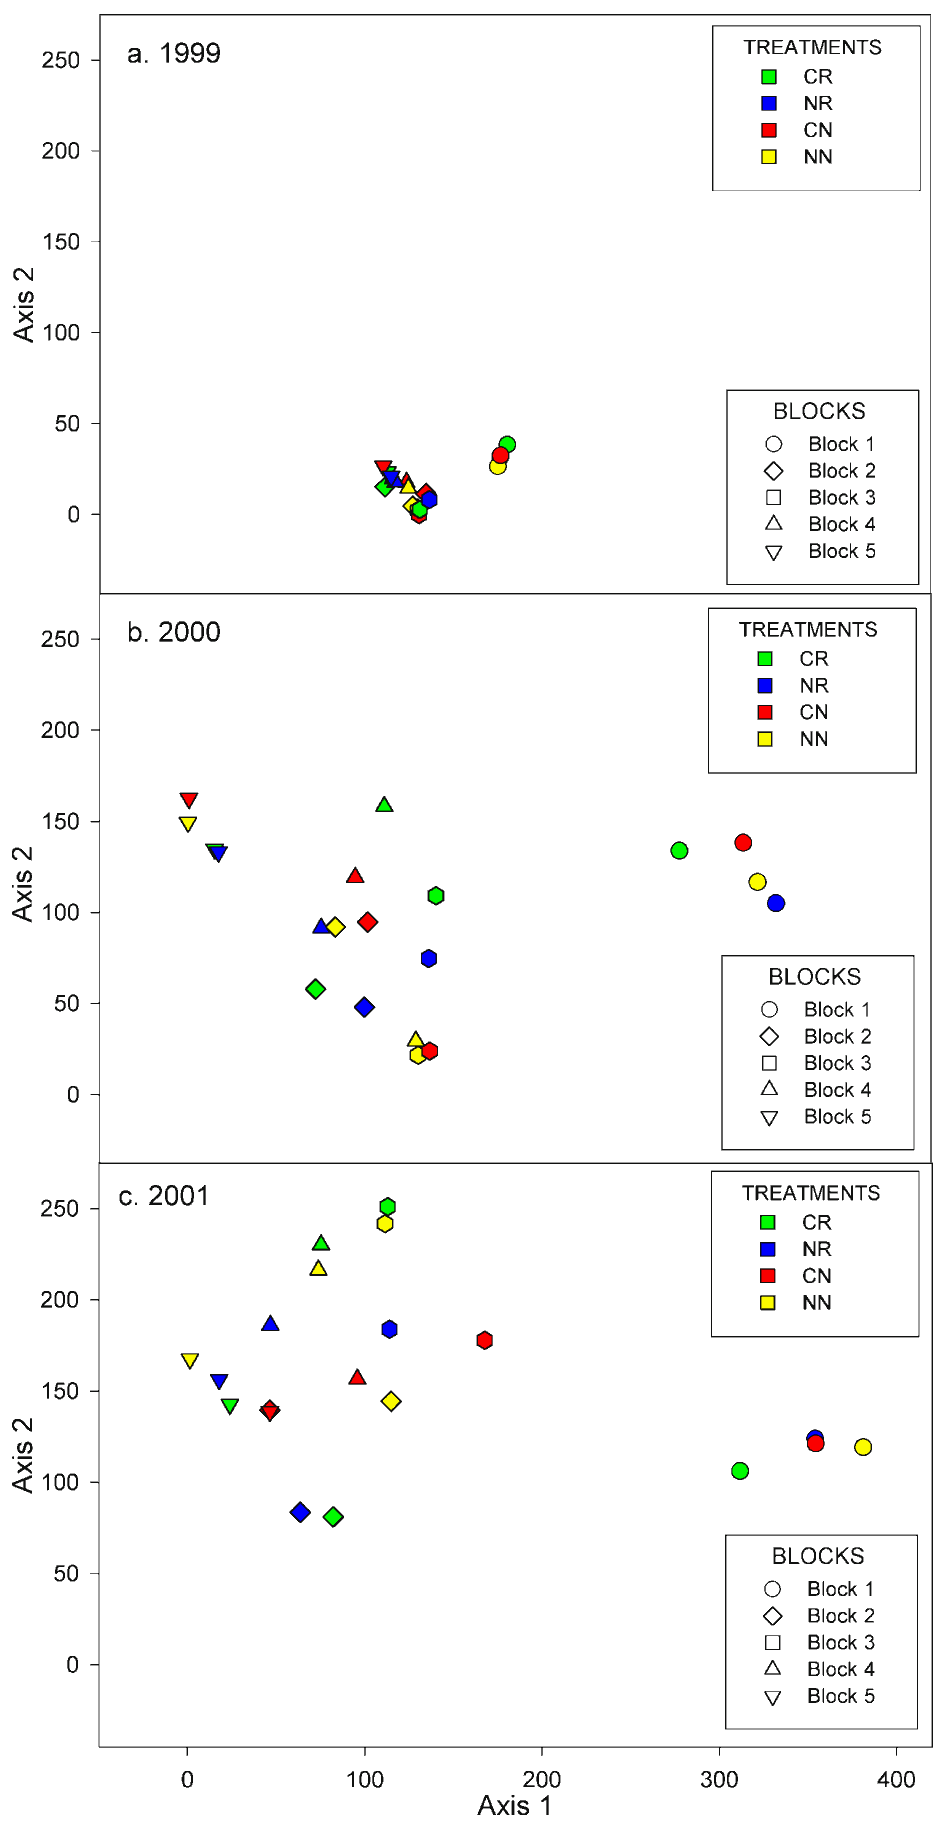
Figure 5.
Ordinations by Detrended Correspondence Analysis (DCA) of the
Tranquillity HRS plot vegetation. See text for
interpretation.
Additional insight into the floristic structure of the study plots is obtained by graphing the relative abundance of species (i.e., their percent contribution to the total vegetation present) against their rank (e.g., most abundant, etc.). These "rank abundance graphs" were generated for the data from the 3 years of vegetation sampling (Appendix B, Figures B1-B5). These graphs can be interpreted by examining the position (i.e., the rank) of the various species and also by considering the slope of the plotted line. A steeper slope suggests dominance by a single species, or by a few species, while a more gradual slope suggests a tendency towards "evenness" (i.e., a more equitable contribution from a greater number of species). It is apparent from these graphs (Appendix B, Figures B1-B5) that in 2000 the seeded plots (i.e., treatments CR and NR) were both more diverse and tended towards greater evenness than the non-seeded plots (i.e., less likely to be dominated by a single species). Nevertheless, it is also apparent that in 2001 both diversity and evenness had diminished from the levels recorded for 2000.
The overall dominance of introduced species also is apparent in the rank abundance graphs (Figures Appendix B, Figures B1-B5). Only a single study plot in 2000 (Appendix B, Figure B4-a) and in 2001 (Appendix B, Figure B3-a) had a native species providing the greatest amount of cover. In both cases, the dominant species was Atriplex argentea , an 'undesirable' native.
As might be expected, many of the non-native species noted in the Tranquillity HRS plots were ruderals. Six of these were included in the CalEPPC list of Pest Plants of Greatest Ecological Concern (California Exotic Pest Plant Council, 1999; Table 4). Of these, three species, Avena fatua , Bromus madritensis subsp. rubens and Brassica nigra , could be described as frequent, with only A. fatua present in any real abundance (Appendix A, Table A1). Two species, B. madritensis and Convolvulus arvensis (Table 4), were listed as noxious weeds (Class "C") by the California Department of Food and Agriculture (2001).
Table 4. Known "pest plants" observed in the Tranquillity HRS plots. See key for an elaboration of their status as weeds.
|
Species |
CalEPPC Status 1 |
CDFA Status 2 |
Frequency 3 |
Cover 4 |
Site cover 5 |
||||||
|---|---|---|---|---|---|---|---|---|---|---|---|
|
1999 |
2000 |
2001 |
1999 |
2000 |
2001 |
1999 |
2000 |
2001 |
|||
|
Avena fatua |
a |
- |
2 |
4 |
83 |
3.00 |
1.75 |
15.72 |
<0.01 |
<0.01 |
2.72 |
|
Bassia hyssopifolia |
b |
- |
- |
- |
1 |
- |
- |
0.5 |
- |
- |
<0.01 |
|
Brassica nigra |
b |
- |
39 |
40 |
73 |
3.01 |
7.91 |
21.71 |
0.24 |
0.66 |
0.80 |
|
Bromus madritensis subsp. rubens |
c |
- |
94 |
89 |
94 |
2.80 |
21.46 |
32.07 |
0.55 |
3.98 |
6.28 |
|
Convolvulus arvensis |
d |
c |
2 |
1 |
- |
0.50 |
0.50 |
- |
<0.01 |
<0.01 |
- |
|
Salsola tragus |
e |
c |
- |
- |
13 |
- |
- |
13.96 |
- |
- |
0.38 |
|
|||||||||||
iii. Discussion
Of particular interest, 5 of the 13 species that were imprinted when the study plots were established ( Allenrolfea occidentalis , Atriplex polycarpa , Atriplex spinifera , Heliotropium curassavicum , and Sporobolus airoides ; Table 1), have not been noted during vegetation sampling. However, the absence of at least one of these species also was due to random sampling procedures, as numerous individuals of Atriplex polycarpa were in evidence on many of the imprinted plots. Sampling methodology will need to be refined for subsequent years, in order to reduce this type of error. Nevertheless, of the remaining four species no individuals were noted either in the quadrats or elsewhere on the plots. The poor performance of these species raises the question whether they should be utilized in future restoration efforts at the Tranquillity HRS site. Nevertheless, it should be noted that the absence of these species could also be explained by any number of factors-e.g., poor quality seed, insufficient rainfall, unsuitable soil conditions, etc.
The absence or paucity of a number of these species is puzzling. Allenrolfea occidentalis is a common and very conspicuous component of remnant areas of non-tilled ground in the general area of the study site. Yet, it has not been established in either the Tranquillity HRS study plots nor in the 160-acre restoration in Section 23 (see the Site-wide Activities section). Furthermore, two different seeding techniques were used for this species, with the seed imprinted in the study plots and hand broadcast following the imprinting of other species at Section 23 (see Uptain et al. 2000). As with other members of the Chenopodiaceae (Khan et al. 2002), A. occidentalis is generally more successfully established if some treatment is applied to help break dormancy (Gul and Weber 1997). Additionally, we have observed that, in natural habitats, Atriplex species seem to require the correct combination of circumstances to achieve germination. It may very well be that the dry conditions that have characterized the initial three years of the Habitat Restoration Study have been the principal factor limiting Atriplex establishment in the study plots.
The dearth of Hemizonia pungens , (i.e., noted in a single sample) is of particular interest. This species is extremely abundant in various remnant native habitat patches in the Tranquillity area, and germinates sufficiently early in the growing season to be capable of competing with the weeds at the HRS site. Additionally, an examination of historic records and existing relict vegetation in the San Joaquin Valley indicated that tarweeds (i.e., Holocarpha spp. and Hemizonia spp.) were dominant in low precipitation areas and on infertile soils (Holstein 2001). The absence of Heliotropium curassavicum is similarly confounding, as this species is very common in disturbed habitats (e.g., roadsides, edges of fields) throughout the general HRS area. Yet, despite the high degree of disturbance associated with soil preparation and imprinting, H. curassavicum has yet to be noted in any of the areas in which it has been imprinted. In both cases, the failure of these species to become established may well be attributable to their ecotype having originated from outside the San Joaquin Valley, but we lack sufficient information on seed sources to state this with certainty.
The general impression from the initial vegetation sampling of the imprinted study plots (i.e., 2000) was that the restoration efforts had been reasonably successful (Uptain et al. 2001). However, based on this year's sampling it appears that the success of the restoration may be ephemeral. Some species that appeared to be well-established in 2000 (e.g., Bromus carinatus , Lasthenia californica and Vulpia microstachys ) diminished in both frequency and percent cover by the following year's sampling. Additionally, we had hoped that a portion of the seeds that had been imprinted but which did not germinate in 2000 would persist in the seed bank and germinate during the subsequent year ( sensu Heady 1977). This does not seem to have been the case, as only two imprinted species- Hemizonia pungens and Leymus triticoides -were more abundant in 2001 than in 2000. However, in both instances, these species were rarely encountered ( H. pungens in one quadrat; L. triticoides in seven quadrats); hence, it does not appear that there was any significant germination of seeds in the year following imprinting. Nevertheless, it should also be noted that both 2000 and 2001 were poor years for native plant production throughout the southern San Joaquin Valley (E. Cypher, pers. com.). Therefore, it may well be that viable seeds from imprinting remain in the seed bank, and that these will be able to become established if appropriate weather conditions occur in 2002.
We also observed in 2000 that some native species that hadn't been included in the seed mix (e.g., Asclepias fascicularis ) had become established as volunteers on the study plots (Uptain et al. 2001). With the exception of the undesirable tumbleweed, Atriplex argentea , there was little evidence that non-imprinted native plant species were becoming established on the study plots in 2001.
b. Invertebrate Surveys
i. Methods
Pitfall sampling to determine invertebrate richness and abundance was conducted from 20-22 June, 2001. Invertebrates were collected from 20 pitfalls configured in 5 arrays on each of the 20 study plots. The methods used to collect pitfall samples are described in previous reports (Selmon et al. 2000, Uptain et al. 2001). Because there were some corrections made to the information contained in the invertebrate databases, the information in this report supercedes that which was presented in previous annual reports (Selmon et al. 2000, Uptain et al. 2001).
The vertical structure of the vegetation on many study plots has developed sufficiently to provide habitat for invertebrates. Pitfall sampling adequately samples ground-dwelling invertebrates, but it does not adequately sample invertebrates occupying this upper tier of vegetation. To rectify this, sweep sampling for invertebrates was added to the HRS sampling protocols in August 2000 to gather richness, abundance, and composition information for these invertebrates. Methods used to collect sweep samples were presented in Uptain et al. (2001). Sweep sampling was conducted on 30 April; 1, 7 and 30 May; 25 June; and 10-11 September 2001. Those data are currently being sorted, identified, and added to the database. Accordingly, the information presented below does not include results of the sweep sampling effort, but rather, richness, abundance, and composition is based solely upon invertebrate collections from pitfalls.
ii. Results
Invertebrate richness did not vary by treatment in any year, nor did richness vary among any given year across treatments (Figure 6). However, some trends are apparent. There was a trend of lower richness for all treatments 2000, in 1999 the non-contoured but restored plots (NR) had the highest richness, and in 2001 the control plots had the highest richness. Mean abundance of invertebrates did not vary by treatment, except in 2001 where the contoured but non-restored plots had the fewest invertebrates (Figure 7). For most treatments, there was a trend of increasing invertebrate abundance from 1999 to 2000, then decreasing abundance in 2001.
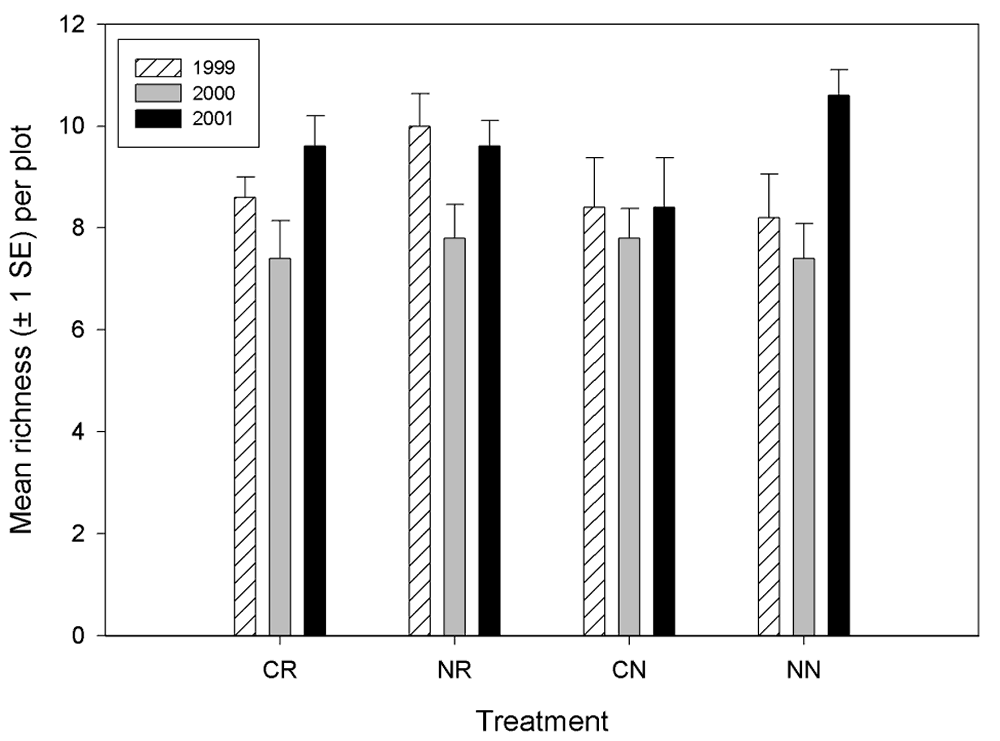
Figure 6.
Invertebrate richness (generated from pitfall data) by
treatment at the Tranquillity site.
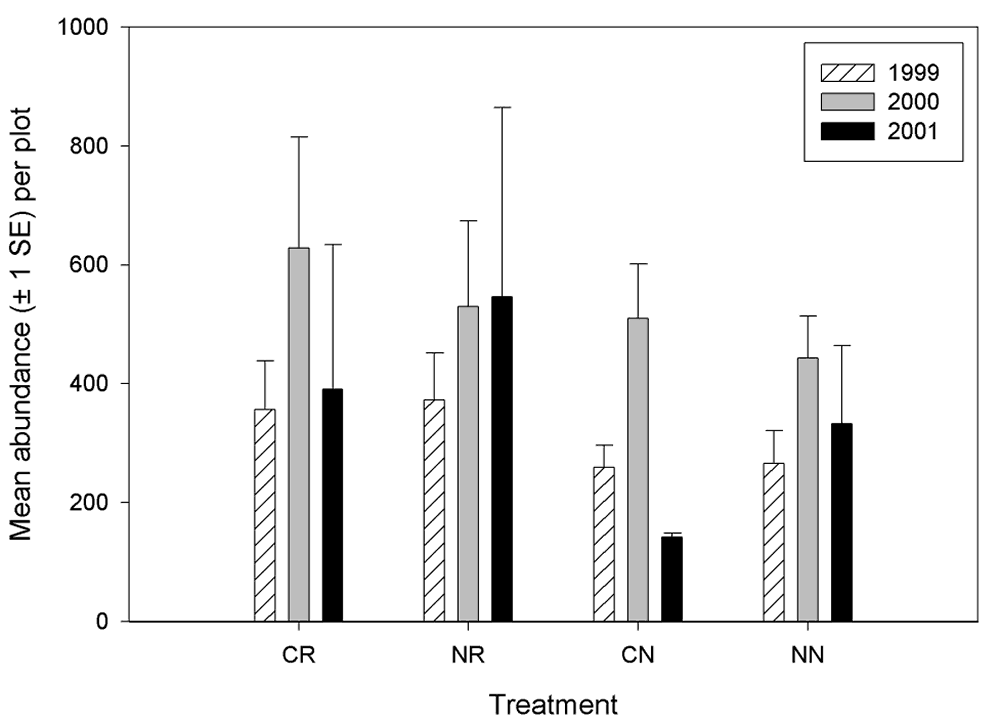
Figure 7.
Invertebrate abundance (generated from pitfall data) by
treatment at the Tranquillity site.
There were differences in invertebrate richness and abundance among the blocks (Figures 8 and 9). The most notable differences in richness were that block 1 had greater richness than any other block during all years and that block 3 had a relative low richness in 2000. Abundance among the blocks were most similar in 1999 and most variable in 2001, indicating that blocking effect is increasing. Furthermore, there is no defined pattern of blocking effect on abundance that is consistent through the years (i.e., certain blocks do not tend to remain higher or lower in abundance than other blocks from year to year). However, the total number of invertebrates collected over the 3-year period was less on blocks 1 and 5 than on the other three blocks.
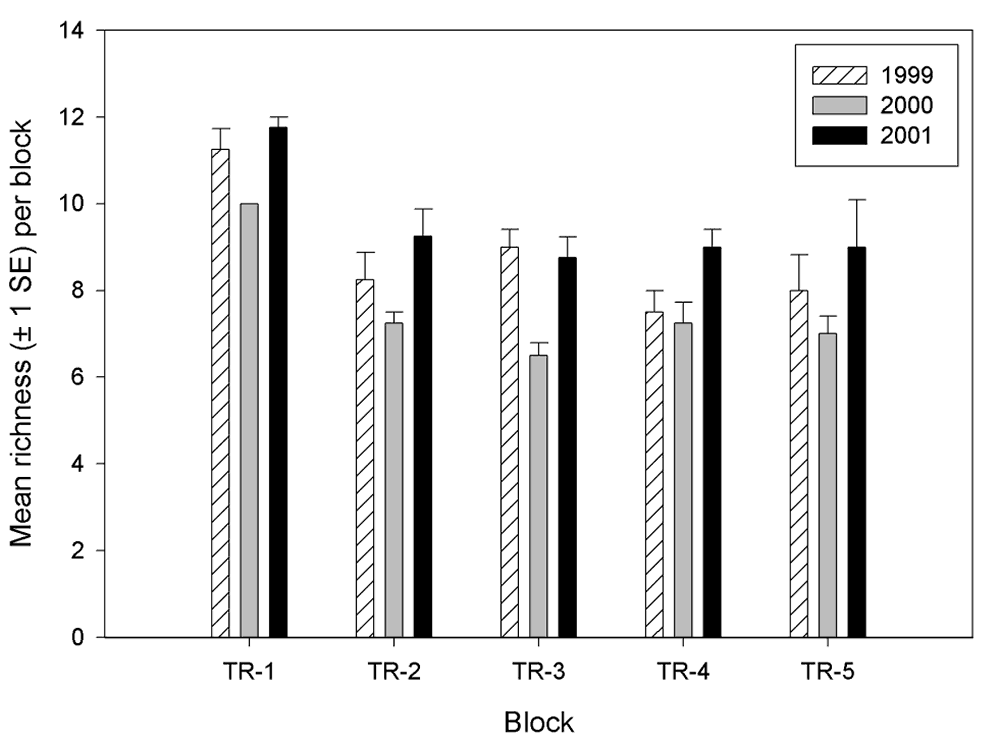
Figure 8.
Invertebrate richness by block at the Tranquillity (TR)
site.
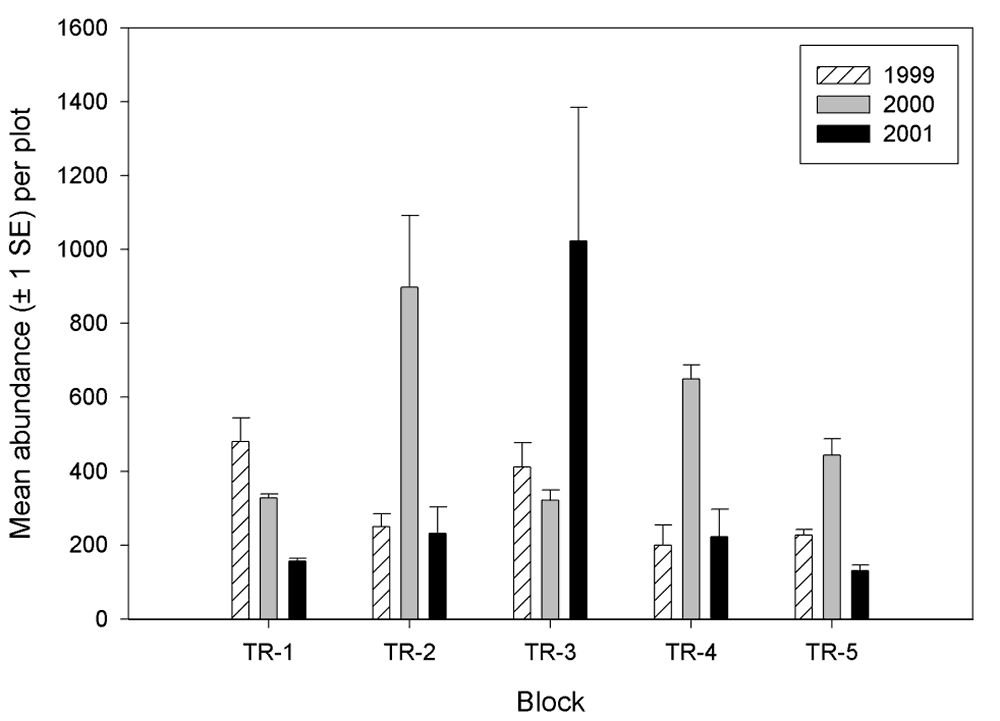
Figure 9.
Invertebrate abundance by block at the Tranquillity (TR)
site.
Invertebrate composition exhibited temporal changes (Table 5). Thysanoptera dominated the invertebrate population in 1999 whereas Hemiptera and, secondarily, Thysanoptera dominated in 2000. In 2001 Orthoptera was dominant. Although there were just a few orders that were dominant in each year, there was a trend towards increasing evenness from 1999 to 2001 (Table 5).
Table 5. Composition (abundance of each order divided by total abundance) of invertebrates collected in pitfall traps at the Tranquillity site, 1999 to 2001.
|
Order |
1999 Composition |
2000 Composition |
2001 Composition |
|---|---|---|---|
|
Araneae |
12.02% |
6.12% |
15.87% |
|
Coleoptera |
11.63% |
2.01% |
7.42% |
|
Dermaptera |
6.56% |
1.11% |
0.50% |
|
Hemiptera |
1.25% |
43.50% |
1.26% |
|
Homoptera |
0.01% |
0.00% |
13.91% |
|
Isopoda |
0.88% |
6.42% |
8.66% |
|
Orthoptera |
2.81% |
11.22% |
43.04% |
|
Thysanoptera |
64.07% |
25.75% |
4.19% |
|
Other |
0.77% |
3.87% |
5.15% |
iii. Discussion
We suspect that the decline in richness in 2000 was due to a rapid change in the weather as spring progressed. The spring of 2000 was long and cool, rapidly shifting to a hot summer. When the scheduled sampling was finally conducted, invertebrate richness had likely declined from earlier in the season. There was a trend toward increasing evenness in the invertebrate communities over the blocks, however. We are not surprised that there was an increase in blocking effect in 2000 and 2001 over that observed in 1999 because in 1999, all blocks were planted in barley and should have been relatively similar in vegetative structure. We expect, however, that as communities develop on the site over time that any remaining blocking effects will be due to edaphic differences among blocks.
c. Reptile and Amphibian Surveys
i. Methods
In previous years, reptiles and amphibians were only sampled in conjunction with the invertebrate pitfall sampling and by incidental observations. In 2001, we augmented this approach by walking 2 transects and monitoring 4 cover boards on each plot (Figure 10). These surveys were conducted on 11-13 July 2001; focused surveys for amphibians were scheduled for December 2001, but were cancelled due to poor weather conditions precluding access to the site.
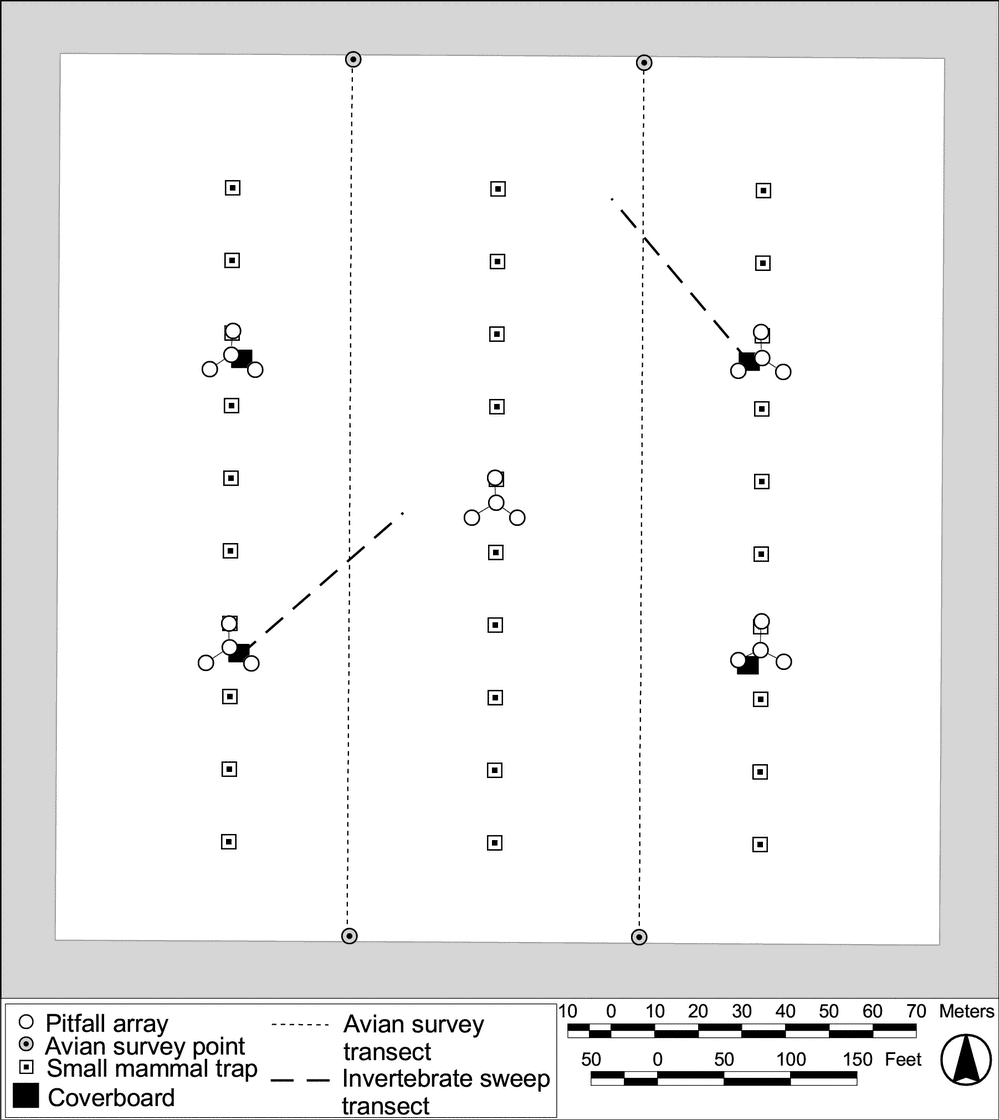
Figure 10.
Locations of pitfall arrays, sweep transects, cover boards,
avian transects, and small mammal trapping lines on
Tranquillity HRS plot.
ii. Results
No reptiles or amphibians were found during the 3-day focused surveys, nor were any found in the pitfall arrays. There was one unconfirmed sighting of a western fence lizard ( Sceloporus occidentalis ) on Plot 7 and a confirmed sighting of a California king snake ( Lampropeltis getulus californiae ) on Plot 4. Both of these sightings occurred in April 2001. Numerous western toads ( Bufo boreas ) and 1 California king snake were observed off of the research blocks while conducting site-wide surveys (see section III A 2).
iii. Discussion
For a variety of reasons it is not surprising that amphibians and reptiles still are absent from the research plots. Some of these are:
- after two years, the study plots contain habitat that is minimally suitable for reptiles and amphibians
- the study plots are isolated by large buffer areas of barley, making access to the plots by reptiles and amphibians from surrounding areas problematic
- the small size of the study plots relative to the habitat needs of some reptiles and amphibians may limit the number of species able to colonize the study plots
- there is little remaining habitat for reptiles and amphibians in the vicinity of the study plots, which presumably has resulted in depressed populations throughout the area
The most common amphibian in the vicinity is the western toad. This species would seem be the most likely candidate to colonize the study plots. However, with the reduction in irrigation water and the lack of moisture, the plots are minimally suitable for this species. Accordingly, we do not expect to record a high abundance of western toads on the study plots.
d. Avian Surveys
i. Methods
Bird surveys were conducted on each plot on a quarterly basis to determine seasonal avian richness, abundance, and composition. Sampling was conducted on 17-19 January, 18-20 April, 18-20 July, and 2-4 October 2001. Methods used for sampling follow those presented in previous reports (Selmon et al. 2000, Uptain et al. 2001).
ii. Results
A total of 28 species was observed on the study plots in 2001. Avian species richness ranged from 1.0 to 6.4 and mean abundance of individuals ranged from 0.13 to 154.3 in 2001. Both richness and abundance showed high variation by season with high values for both categories occurring in the winter (Figures 10 and 11). No differences were detected between treatments for either species richness or mean abundance in 2001.
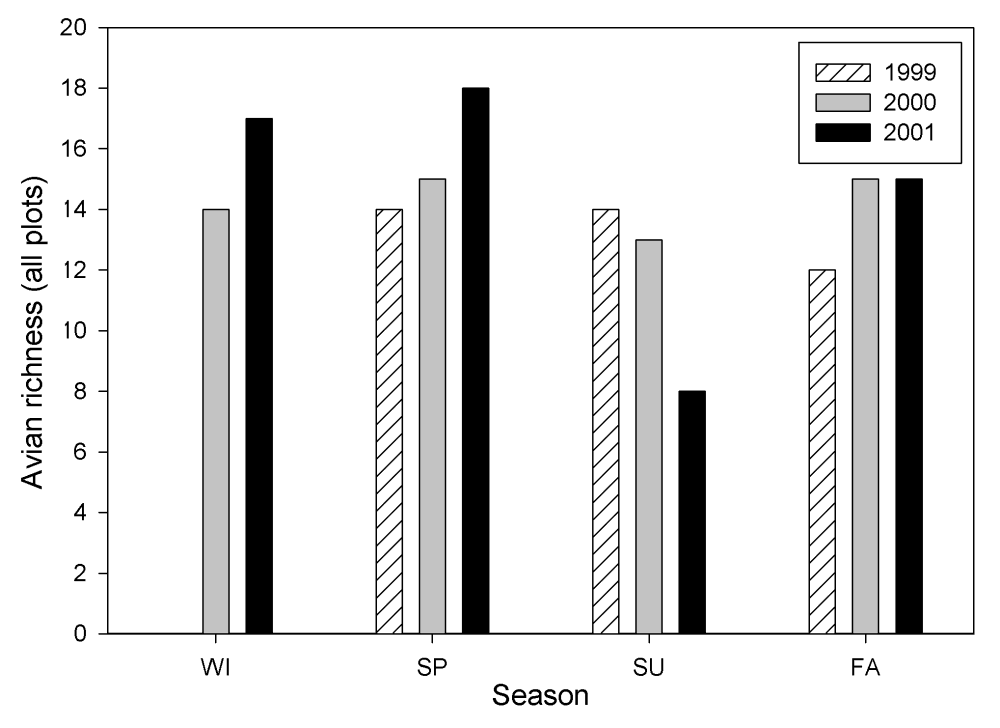
Figure 11.
Avian richness by season at the Tranquillity site.
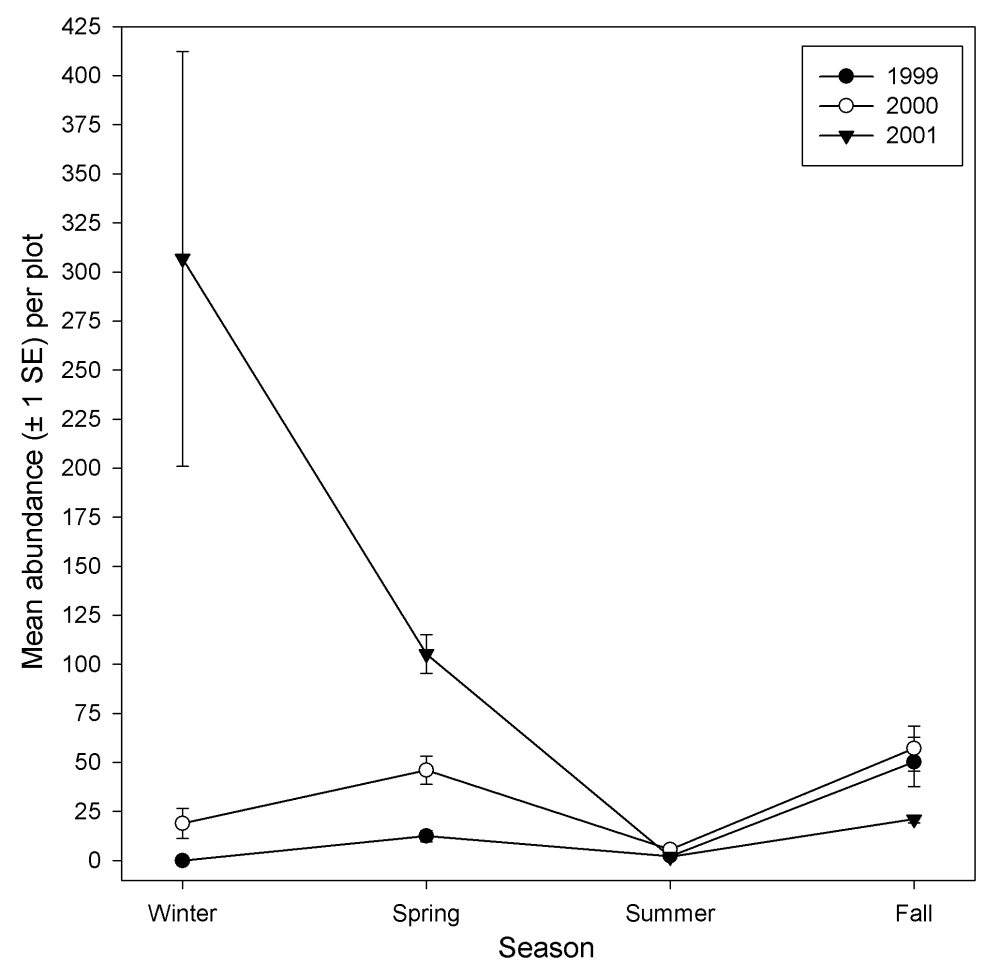
Figure 12.
Avian abundance by season at the Tranquillity site.
Mean abundance and species richness also were examined across years. Mean abundance consistently increased across treatments from 1999 to 2001 in the spring, and from 2000 to 2001 in the winter. This was concomitant with an increase in species richness for the same time period. The mean total abundance was consistently lower across treatments in the fall of 2001 than in the previous 2 years.
Six species of special concern in California (CSC) or federal special concern species (FSC) were observed on the study plots. Short-eared owls ( Asio flammeus ) (CSC) showed a dramatic increase in abundance in 2001. Only a few individuals had been reported in the previous 2 years, but in 2001 this species ranked within the top five most abundant birds for the summer season (Table 6). This species was breeding on one of the control plots, where it was most frequently observed. However, short-eared owls also were observed on plots with all other treatments. Burrowing owls ( Athene cunicularia ) (FSC, CSC) were not observed on any plots in 1999 or 2000, but one individual was observed occupying a burrow on a control plot in 2001. Northern harriers ( Circus cyaneus ) (CSC) also showed an increasing population trend and were confirmed to be breeding on the plots. One species of special concern, the horned lark ( Eremophila alpestris ) appears to have declined on the study plots since 1999.
Table 6. Avian relative abundance and ranked species composition on the Tranquillity site study plots, 1999 to 2001.
|
Winter 1999 |
Winter 2000 |
Winter 2001 |
||||||||
|---|---|---|---|---|---|---|---|---|---|---|
|
Species 1 |
R.A. 2 |
Rank 3 |
Species 1 |
R.A. 2 |
Rank 3 |
Species 1 |
R.A. 2 |
Rank 3 |
||
|
|
|
|
BRBL |
50.80 |
1 |
SAVS |
49.80 |
1 |
||
|
|
|
|
SAVS |
9.63 |
2 |
BRBL |
19.65 |
2 |
||
|
|
N/A |
|
MOPL |
8.02 |
3 |
WEME |
17.41 |
3 |
||
|
|
|
|
LBCU |
6.95 |
4 |
RWBL |
3.62 |
4 |
||
|
|
|
|
AMKE |
5.88 |
5 |
WCSP |
2.82 |
5 |
||
|
Spring 1999 |
Spring 2000 |
Spring 2001 |
||||||||
|
Species 1 |
R.A. 2 |
Rank 3 |
Species 1 |
R.A. 2 |
Rank 3 |
Species 1 |
R.A. 2 |
Rank 3 |
||
|
RWBL |
54.58 |
1 |
RWBL |
77.59 |
1 |
RWBL |
77.34 |
1 |
||
|
BRBL |
18.33 |
2 |
BRBL |
10.82 |
2 |
SAVS |
9.27 |
2 |
||
|
YHBL |
8.33 |
3 |
WEME |
6.73 |
3 |
WCSP |
3.92 |
3 |
||
|
WEME |
6.67 |
4 |
MALL |
0.99 |
4 |
SOSP |
3.59 |
4 |
||
|
MALL |
3.33 |
5 |
CLSW |
0.66 |
5 |
WEME |
2.06 |
5 |
||
|
|
|
|
NOHA |
0.66 |
5 |
|
|
|
||
|
|
|
|
RNPH |
0.66 |
5 |
|
|
|
||
|
|
|
|
SAVS |
0.66 |
5 |
|
|
|
||
|
Summer 1999 |
Summer 2000 |
Summer 20001 |
||||||||
|
Species 1 |
R.A. 2 |
Rank 3 |
Species 1 |
R.A. 2 |
Rank 3 |
Species 1 |
R.A. 2 |
Rank 3 |
||
|
AMKE |
21.74 |
1 |
WEME |
57.94 |
1 |
WEME |
25.64 |
1 |
||
|
WHIM |
17.39 |
2 |
RWBL |
19.63 |
2 |
BARS |
17.95 |
2 |
||
|
WEME |
15.22 |
3 |
WTKI |
3.74 |
3 |
NOHA |
17.95 |
2 |
||
|
CORA |
8.70 |
4 |
AMKE |
2.80 |
4 |
WTKI |
15.38 |
3 |
||
|
NOHA |
8.70 |
4 |
BAOW |
2.80 |
4 |
LOSH |
7.69 |
4 |
||
|
LOSH |
6.52 |
5 |
BARS |
2.80 |
4 |
SEOW |
7.69 |
4 |
||
|
|
|
|
WEKI |
2.80 |
4 |
WEKI |
5.13 |
5 |
||
|
|
|
|
CORA |
1.87 |
5 |
|
|
|
||
|
|
|
|
SOSP |
1.87 |
5 |
|
|
|
||
|
Fall 1999 |
Fall 2000 |
Fall 2001 |
||||||||
|
Species 1 |
R.A. 2 |
Rank 3 |
Species 1 |
R.A. 2 |
Rank 3 |
Species 1 |
R.A. 2 |
Rank 3 |
||
|
AMPI |
24.71 |
1 |
SAVS |
64.68 |
1 |
SAVS |
46.01 |
1 |
||
|
WEME |
22.46 |
2 |
WEME |
21.11 |
2 |
WEME |
42.02 |
2 |
||
|
SAVS |
19.25 |
3 |
RWBL |
3.13 |
3 |
SOSP |
2.66 |
3 |
||
|
BRBL |
13.37 |
4 |
WTKI |
2.51 |
4 |
HOLA |
1.60 |
4 |
||
|
HOLA |
11.66 |
5 |
BRBL |
2.30 |
5 |
WCSP |
1.60 |
4 |
||
|
|
|
|
|
|
|
BRBL |
1.33 |
5 |
||
|
||||||||||
iii. Discussion
The majority of the avian species (59%) recorded on the study plots are considered to be grassland specialists (Appendix B) . Grassland specialists are separated into two categories: obligate grassland specialists, which are exclusively adapted to and entirely dependent on grassland habitats, and facultative grassland specialists, which are not entirely dependent on grasslands but use them commonly (Vickery et al. 1999). Nine avian species on the study plots are categorized as obligate grassland specialists and 13 as facultative grassland specialists. The development of a more complex plant community on LRDP lands has been accompanied by changes in the avian community dynamics. Many of the grassland specialists have increased in numbers following the cessation of cultivation and the establishment of permanent herbaceous cover.
Species composition shifted seasonally (Figure 13). Blackbirds (Brewer's and red-winged blackbirds)( Euphagus cyanocephalus, Agelaius phoeniceus ) predominated in winter and spring, western meadowlarks ( Sturnella neglecta ) generally predominated in summer, and savannah sparrows ( Passerculus sandwichensis ) and western meadowlarks predominated in the fall. Large mixed-species flocks of 500 or more blackbirds were frequently seen in the barley and on the plots during the winter 2001 census. Flocks of this magnitude were not observed in 1999 and only occasionally during 2000. These mixed flocks were generalized as "blackbirds" because of the large numbers and an inability to reliably distinguish composition. Accordingly, they were not included in the rank abundance table (Table 6) or in the seasonal relative abundance figure (Figure 13). Although not shown graphically or in tabular form, Brewer's and red-winged blackbirds increased exponentially in abundance in 2001. It is likely that the increase of these facultative grassland specialists is a result of the barley cover crop that is maintained in the buffers and the lack of cultivation on the study plots. Savannah sparrows and western meadowlarks, two obligate grassland specialists, showed a similar response to changes in vegetative cover. Both have been more prevalent on the study plots since 1999.
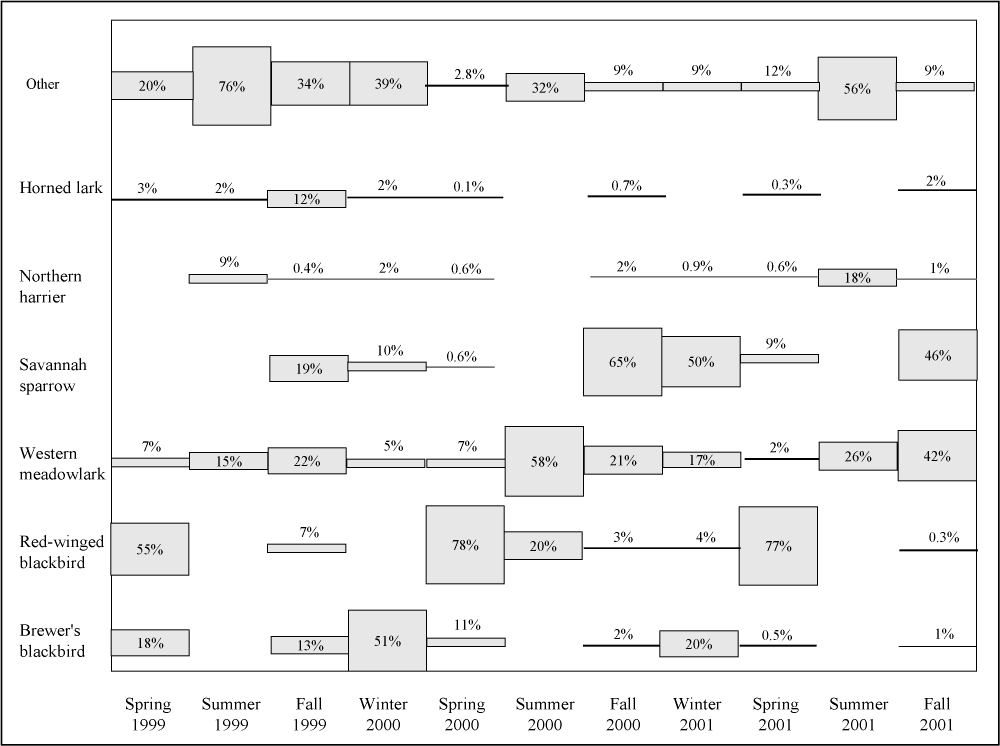
Figure 13.
Seasonal relative abundance of selected avian species at the
Tranquillity site.
Only two grassland specialists appear to have decreased in abundance on the study plots. Horned larks and American pipits ( Anthus rubescens ) were both present in relatively high numbers in 1999, but have since declined. Horned larks and American pipits prefer open areas with short vegetation or bare ground for both breeding and wintering habitats (Beason 1995, Kauffman 1996). The dense tall cover of London rocket ( Sisymbrium irio ) and barley ( Hordeum vulgare ) probably made most of the study plots unsuitable for both of these species. Nevertheless, they are still frequently recorded in the cultivated buffer region surrounding the plots.
Relative abundance values for the spring season of 2001 were consistently higher across all treatments than for either of the two previous spring seasons. In contrast, relative abundance for the fall season of 2001 was consistently lower across all treatments than for the previous two fall seasons. This disparity may be the result of annual fluctuations in the timing of migration. Decreasing day length along with weather conditions stimulates fall migration departures (Gill 1995). It seems likely that the 2001 fall census may have occurred in the transitional period subsequent to the departure of the fall migrants, but prior to the arrival of the wintering species.
e. Small Mammal Surveys
i. Methods
Small mammal trapping was conducted on each plot on a quarterly basis to determine seasonal richness and abundance of species. Trapping was conducted on 27 February-2 March; 30 April-3 May; 6-9 August; and, 5-8 November, 2001. Sherman live-traps were used for and trapping methods followed those presented in previous reports (Selmon et al. 2000, Uptain et al. 2001). Additionally, small mammals (especially shrews) were sampled using the pitfall traps established for sampling invertebrates.
ii. Results
During nocturnal live-trapping in 2001, a total of 2,362 small mammals were captured on the experimental plots. A total of 2,314 deer mice ( Peromyscus maniculatus ), 46 house mice ( Mus musculus ), one western harvest mouse ( Reithrodontomys megalotis ), and one California vole ( Microtus californicus ) were captured.
A trend of increasing small mammal abundance across all years during each sampling season (Figure 14) was observed. This was especially apparent in the number of captures of deer mice. As winter data were collected only in 2001, it is not yet possible to discuss trends for this season.
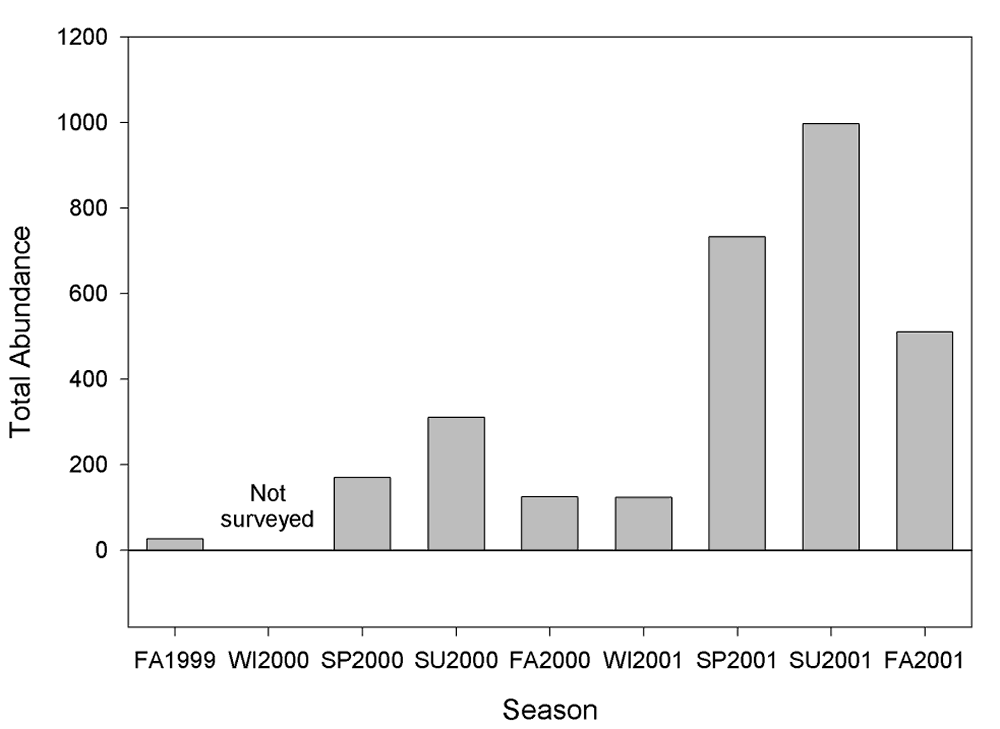
Figure 14.
Abundance of small mammals by season at the Tranquillity
site.
Plots receiving treatments generally had greater numbers of small mammals than did the control plots (Figure 15). During most seasons, small mammal abundance tended to be greater on the contoured and restored plots (CR) than on the plots that only received contouring (CN). This holds true for all seasons and years except fall of 1999 (which preceded treatment installation) and fall of 2000. Because deer mice comprised approximately 98% of all captures of small mammals, these trends essentially were only representative of the deer mouse population. The type of treatment appeared to have no effect on house mice abundance. House mice were captured only on the control plots in every season, and their abundance did not seem to be correlated with treatment. The one western harvest mouse was captured on a plot that was seeded with native plants, and the only vole was captured in a plot treated with contouring.
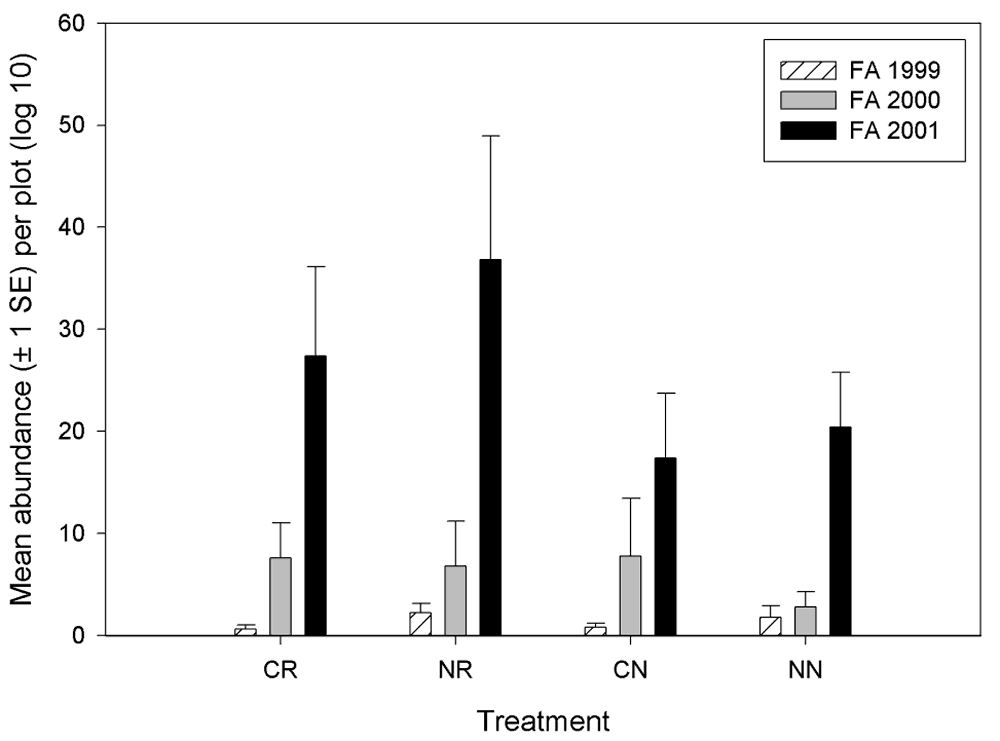
Figure 15.
Abundance of small mammals by treatment at the Tranquillity
site.
Small mammal abundance varied by block, especially in 1999 and 2000. In 2001, block effects diminished, with the exception of Block 1, which had consistently low numbers of small mammal throughout all years (Figure 16).
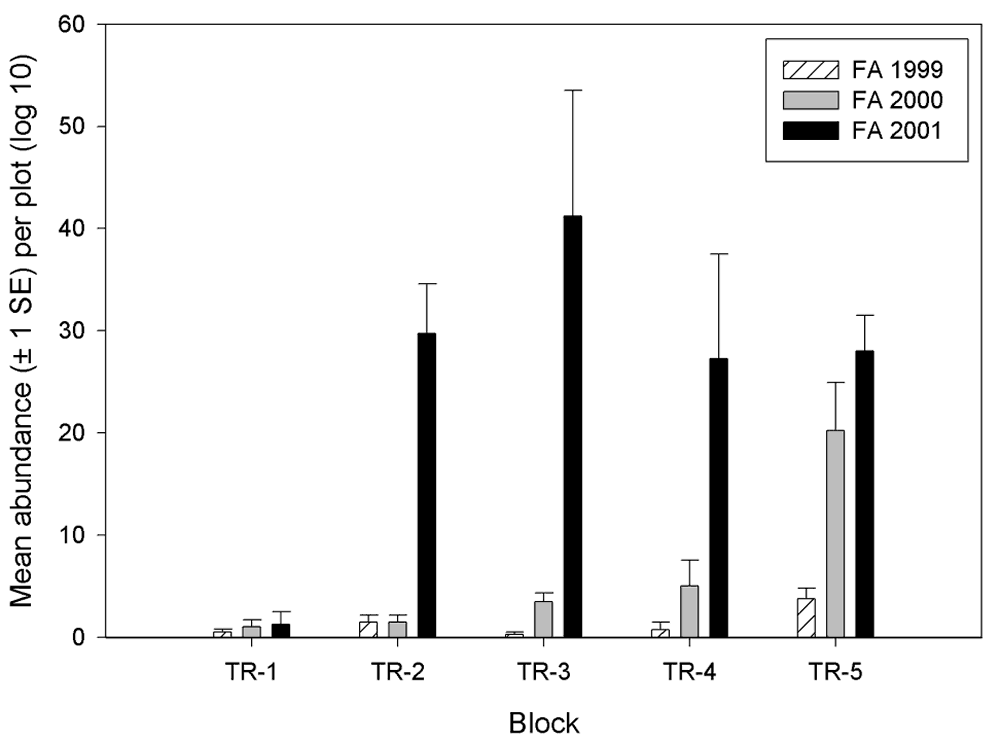
Figure 16.
Abundance of small mammals by block at the Tranquillity
site.
All of the ornate shrews ( Sorex ornatus ) and most of the voles ( Microtus californicus ) were captured in pitfall traps. A total of 25 shrews and 37 voles were captured in 2001 (Table 7). Most of the shrews (88%) were captured on plots that were seeded with native plants. That trend also held true for shrews captured in 2000, when 67% of shrews were captured on seeded plots (Table 7), but the trend did not hold true for 1999 (prior to the treatments being established). By contrast, 62% of the voles that were captured in 2001 were captured on contoured plots and 38% of the voles were captured from seeded plots. In 1999 and 2000, vole captures were not numerous enough for an evaluation of treatment effects.
Table 7. Shrews and voles captured in pitfall traps on the Tranquillity site study plots, 1999 to 2001.
|
Year |
Species |
Common name |
Plot treatment 1 |
Number captured |
|---|---|---|---|---|
|
1999 |
Sorex ornatus |
Ornate shrew |
CR |
1 |
|
CN |
10 |
|||
|
NR |
2 |
|||
|
NN |
1 |
|||
|
Microtus californicus |
California vole |
CR |
1 |
|
|
CN |
1 |
|||
|
NR |
1 |
|||
|
NN |
0 |
|||
|
2000 |
Sorex ornatus |
Ornate shrew |
CR |
7 |
|
CN |
3 |
|||
|
NR |
5 |
|||
|
NN |
3 |
|||
|
Microtus californicus |
California vole |
CR |
0 |
|
|
CN |
0 |
|||
|
NR |
0 |
|||
|
NN |
0 |
|||
|
2001 |
Sorex ornatus |
Ornate shrew |
CR |
11 |
|
CN |
0 |
|||
|
NR |
11 |
|||
|
NN |
3 |
|||
|
Microtus californicus |
California vole |
CR |
4 |
|
|
CN |
19 |
|||
|
NR |
10 |
|||
|
NN |
4 |
|||
|
||||
iii. Discussion
Deer mice are a pioneering species (Zeiner et al. 1990), i.e., a species that occurs in relatively high numbers in the early seral stages of secondary succession. Hence, it is not surprising that their numbers have increased dramatically on the study plots. Typically, deer mice may have home ranges of up to 10 acres (Stickel 1968), but based upon the abundance encountered, home ranges are probably much smaller on the Tranquillity HRS study plots. The high density of deer mice probably can be attributed to an abundant food supply on the plots as well as in adjacent buffers and a lack of periodic disturbance. As the plant community develops on the sites we would expect the deer mouse population to decline and other species such as harvest mice, shrews, voles, and kangaroo rats to become more abundant. As fossorial species (especially gophers, kangaroo rats, and ground squirrels) become established, additional niches would be created and would become available for a wide variety of vertebrate and invertebrate species.
It is not surprising that all captures of shrews were in pitfalls. The bait used in live-traps generally does not attract shrews, whereas invertebrates in the pitfalls provide auditory and olfactory cues for shrews (Churchfield 1990) and an attractive food source. Although the captures in pitfalls provide an index of abundance of shrews on the study plots, a mark-recapture study could provide statistical estimates of abundance and density, assuming sufficient numbers of shrews and multiple captures of the same individuals. Nevertheless the increase in the abundance of shrews on the plots and the seeming tendency of shrews to prefer plots that were seeded with native vegetation are important observations, another observation may prove to be as important. Shrews were relatively abundant on the plots in 1999 prior to treatment installation. This indicates that shrews may have been present on the site during years of agricultural production prior to the HRS study. If this is the case, then ornate shrews may be more abundant and widespread in the San Joaquin Valley than was previously thought.
That voles also were captured more frequently in pitfalls than in live-traps is not surprising. Increases in vole abundance also were observed, especially in 2001, and affinities for certain plot treatments were noted (see Table 7). The most voles were found on plots that were contoured but not restored by seeding with native plants.
The first capture of a western harvest mouse was in 2001. That capture was on a plot that was seeded with native vegetation. This was not surprising given the affinity of the western harvest mouse to feed on native vegetation (Ingles 1947). We expect western harvest mice to become more abundant on the plots as the land is left undisturbed. The value of undisturbed lands to all small mammal populations is apparent from our data.
B. Atwell Island
1. Study Design
The study design for the Habitat Restoration Study at Atwell Island is similar to that at Tranquillity, but differs in some important aspects. At Atwell Island there are 3 replicated blocks, each containing 16 experimental plots (Figure 17). A representation of the configuration of a study block is shown in Figure 18. The plots are 2 acres in size, each nested within a 10-acre parcel. As with Tranquillity, the areas between plots are maintained with a barley cover crop to isolate the plots. Four treatments were applied to the plots in winter 2001: seeding with native plants and contouring, seeding with native plants only, contouring only, and no treatment. The treatments were randomized within blocks of four plots configured in a 2 by 2 grid.
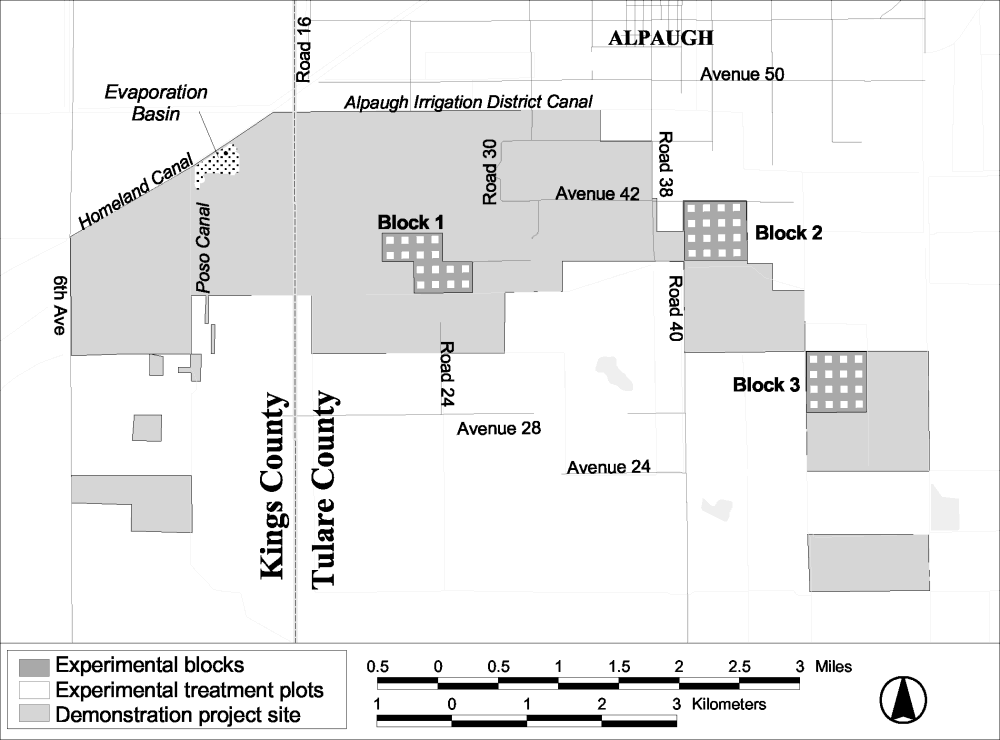
Figure 17.
Map of the Atwell Island site showing the randomized block
design.
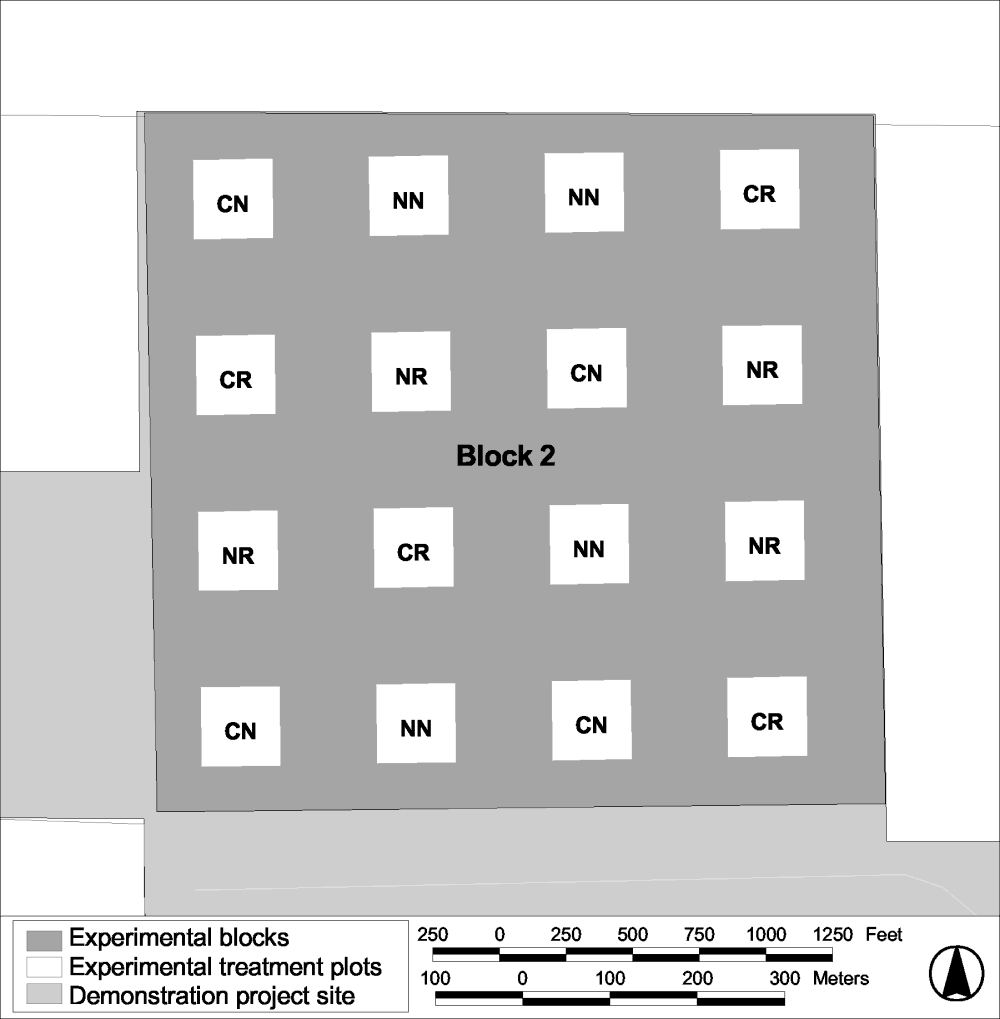
Figure 18.
Map of an experimental block at the Atwell Island site showing
the placement of treatments plots.
Microtopographic contours (berms) were installed on 4-6 December (Block 1), 7-9 December (Block 2), and 10-12 December (Block 3). Contours are of the same general size and shape as those that were installed on the plots at the Tranquillity HRS site. However, there are fewer contours on plots at Atwell Island (49 contours per plot) than there are on plots at Tranquillity site (240 contours per plot) because of the much smaller plot size. Native plant seeding at Atwell Island was conducted on 27 December (Block 1), 18-19 December (Block 2), and 19 December (Block 3). Seeding was accomplished using an imprinter; the seed mix and seeding rate were identical to that used on the Tranquillity HRS site (see Selmon et al. 2000 and Uptain et al. 2001). However, the locations where seeds were collected differed somewhat between the two sites and in neither trial were seeding rates standardized for germination and purity. Because of the low success rate and high cost of planting seedlings on the Tranquillity HRS plots, no seedlings were planted on the Atwell Island plots.
2. Biological Monitoring
Baseline biological surveys was conducted on the Atwell Island HRS plots in 2001 prior to treatment application and while the barley cover crop was still in place. Surveys consisted of:
- vegetation surveys (composition and cover)
- invertebrate surveys (sweep and pitfall)
- amphibian and reptile surveys
- avian surveys
- small mammal surveys
HRS survey methods, results and discussions are presented in the following sections. No temporal comparisons can be made at this time because only baseline data have been gathered. Results of the site-wide survey efforts are presented in the Site-Wide Activities section.
a. Vegetation Surveys
i. Methods
In April 2000, a pre-project inventory was undertaken on the Atwell Island property. Based on recent land use patterns (Uptain et al., 2001), three distinct areas were identified at the site (Figure 19). Lists of all observed vascular plant species were compiled for each area (Appendix A, Table A4). Subsequently, two of the three HRS study blocks were positioned on areas that had been surveyed (blocks 2 and 3; Figure 19). The area on which the third HRS study block (Block 1; Figure 19) was established was previously in agricultural production. As such, the area did not support a significant native flora.
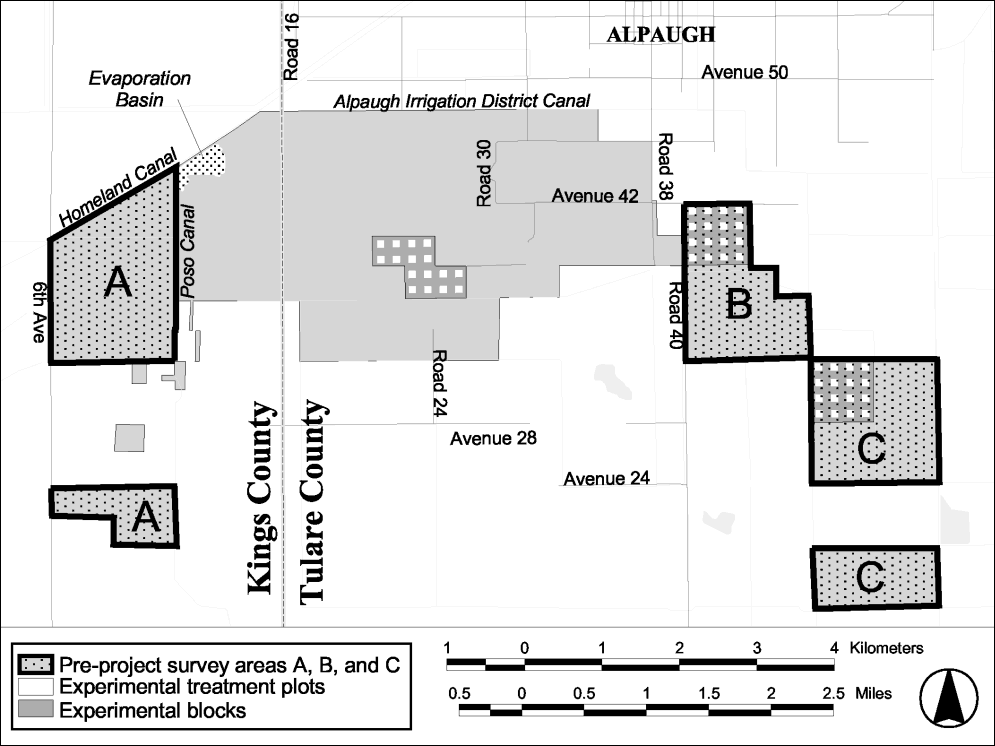
Figure 19.
Locations of research areas at the Atwell Island site.
Baseline vegetation sampling was conducted on the Atwell Island HRS plots in May, 2001 (3-4, 9 May). Eight vegetation samples (35 cm by 70 cm rectangular quadrats) were taken from each plot. Stratified random sampling was employed, with plots divided into quarters and two sampling points chosen at random from within each quarter-plot. All species were noted, and the percent cover for each species was estimated using a modified Daubenmire cover scale (Bonham 1989). Total percent cover of all species within the quadrat was also estimated using the same cover scale. Whenever possible, species were identified completely; failing this, species were assigned morpho-species names.
To document temporal changes in the study plot vegetation, photopoints were established along the southern midline of the plots where digital and 35 mm panoramic photographs were taken. Initial photos were taken on 13 June, 2001; subsequent photo sampling will occur approximately quarterly. Copies of all photos are archived at the ESRP and USBR offices in Fresno.
ii. Results
Thirty-two species of vascular plants were observed on the Atwell Island site during the 2000 pre-project inventory (Columns A-C; Appendix A, Table A4). Of these, all but two species, Allenrolfea occidentalis and Tamarix parviflora , were present in the general areas on which the HRS plots were subsequently installed (i.e., areas A and B; Figure 19). The following year, 49 taxa were noted during baseline sampling of the HRS plots (Appendix A, Table A4). Of these, 26 were completely identified, 9 were identified to the level of genus, 4 to the level of family, and the remaining 10 were identified by morpho-species names.
As expected, Hordeum vulgare (Barley) was ubiquitous and abundant, being present in all quadrats and possessing the largest average percent cover of all species (Appendix A, Table A4). An additional six species, Hordeum murinum , Melilotus indica , Phalaris minor , Amsinckia menziesii , Avena sativa , and Erodium cicutarium , were present in at least a quarter of the study quadrats. Of these, only A. menziesii is native (Appendix A, Table A4). Of the 30 species whose origin could be ascertained, 24 were introduced while only 6 were native (Appendix A, Table A4). By all measures, introduced species were far more prevalent than native species in the Atwell Island HRS study plots (Figure 20).
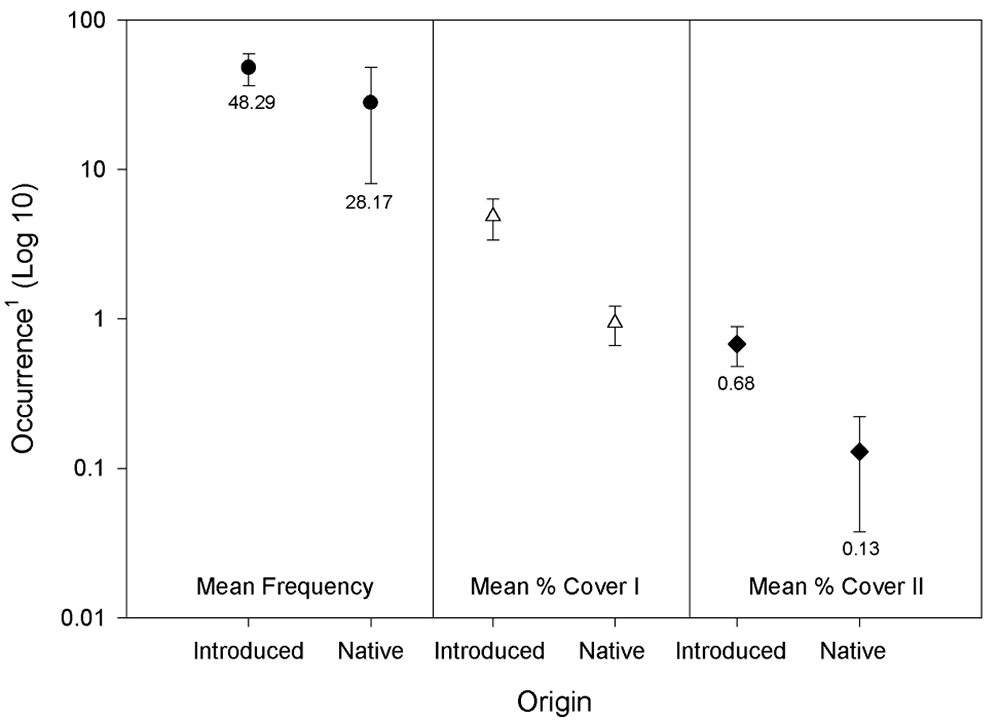
Figure 20.
Differences in abundances between introduced and native species
on the Atwell Island HRS plots. 1. Occurrences: Mean Frequency-
the mean number of quadrats in which a species was noted; for
the abundance estimates, the estimated percent cover; Mean %
Cover I-Estimated average percent cover of the taxon calculated
from only those quadrats in which the species was noted; Mean %
Cover II-Estimated site-wide average percent cover calculated
from the summed cover data divided by the total number (384) of
quadrats.
Excluding barley, thirteen species noted during baseline sampling were not observed during the pre-project inventory. The status of an additional sixteen species was uncertain, due to their identity not being completely known. Also of note, eleven of the thirty species observed in areas B and C during the pre-project inventory were not observed in the HRS plots during baseline sampling (Appendix A, Table A4).
To compare conditions at the Atwell Island HRS during its "baseline" year to those at the Tranquillity HRS during its baseline year, the 20 most abundant species from each site were tabulated and graphed (Figure 21; Table 8½). The ten most abundant species in the Tranquillity HRS plots are labeled sequentially. The ten most abundant species in the Atwell Island HRS plots are also numbered sequentially; however, if a species was also among the ten labeled Tranquillity species, the number used for the Tranquillity data was applied to the plot of the Atwell Island data. For example, the second most abundant species at Atwell Island ( Avena sativa ) was not among the ten most abundant species at Tranquillity; hence, it was assigned its own number (11; Figure 21). In contrast, H. murinum , the fourth most abundant species at Tranquillity was the third most abundant species at Atwell Island, and hence was identified by a "4" in the plot of the Atwell Island Rank-Abundance data (Figure 21).
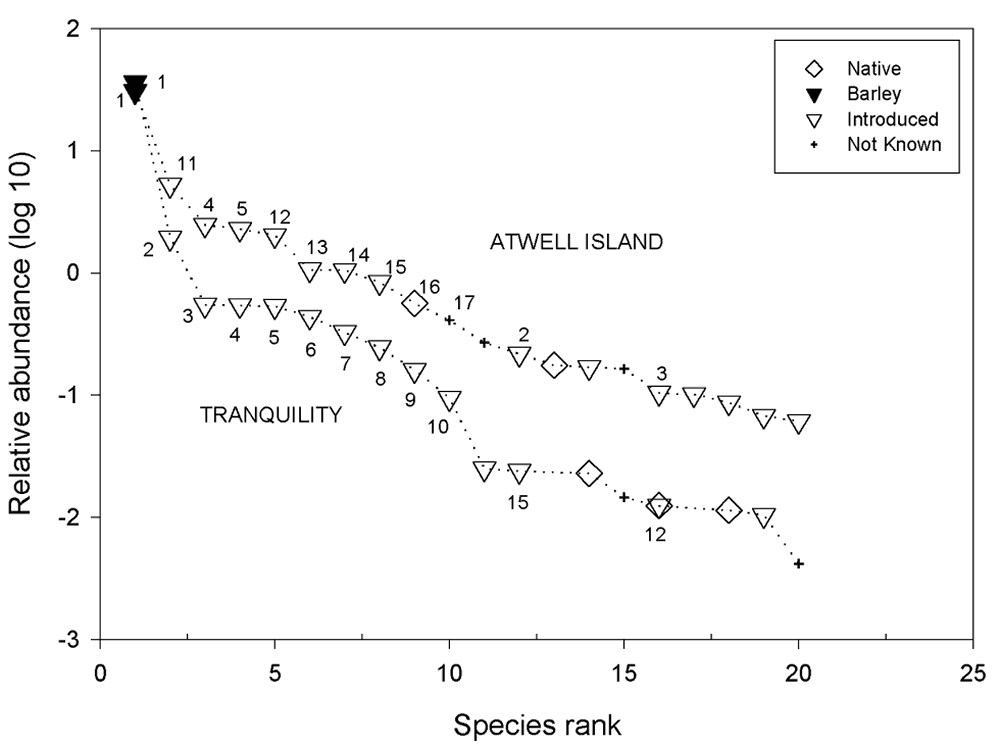
Figure 21.
Rank-abundance of baseline plant species data from the
Tranquillity (1999) and Atwell Island (2001) Habitat
Restoration Studies, showing the 20 species with the greatest
average abundance for each site. Only the ten most abundant
species at each site were assigned numeric labels. Numbers
pertain to species listed in Table 8.
Table 8. The ten most abundant species at the two HRS sites during baseline sampling. Species are presented in descending abundance for each site. Abundance values are based on average percent cover in quadrats.
|
Code 1 |
Tranquillity Site |
Code 1 |
Atwell Island Site |
|---|---|---|---|
|
1 |
Hordeum vulgare (Barley) |
1 |
Hordeum vulgare (Barley) |
|
2 |
Sisymbrium irio |
11 |
Avena sativa |
|
3 |
Bromus madritensis subsp. rubens |
4 |
Hordeum murinum |
|
4 |
Hordeum murinum |
5 |
Melilotus indica |
|
5 |
Melilotus indica |
12 |
Phalaris minor |
|
6 |
Capsella bursa-pastoris |
13 |
Medicago polymorpha |
|
7 |
Beta vulgaris |
14 |
Erodium cicutarium |
|
8 |
Brassica nigra |
15 |
Bassia hyssopifolia |
|
9 |
Senecio vulgaris |
16 |
Amsinckia menziesii |
|
10 |
Sonchus sp. |
17 |
Polygonum sp. |
|
|||
The dominance of barley during the first year of sampling in the HRS study plots can be clearly seen for both Tranquillity and Atwell Island (Figure 21). The two sites shared few floristic similarities beyond the abundance of barley. The second and third most abundant species at the Tranquillity HRS- Sisymbrium irio and Bromus madritensis subsp. rubens -were present at the Atwell Island HRS, but were ranked much lower (11 th and 15 th , respectively). Avena sativa , the second most abundant species at the Atwell Island HRS (Figure 21), was not noted at the Tranquillity HRS during baseline vegetation sampling. The fourth and fifth most abundant species at the Tranquillity HRS- Hordeum murinum and Melilotus indica -also were present at the Atwell Island HRS; however, their abundances at the latter were much lower (11 th and 15 th ranked species, respectively).
In all, 7 of the 10 most abundant species at the Atwell Island HRS were not among the 10 most abundant species at the Tranquillity HRS site (Figure 21). At both sites, introduced species were far more prevalent than native species (Figure 20; Figure 21). This is clearly demonstrated by the absence of all but one native species ( Amsinckia menziesii ) among the ten most abundant species at either site (Figure 21).
As with the Tranquillity HRS site, many of the non-native species in the Atwell Island HRS plots were ruderals. Four of these were included in the CalEPPC list of Pest Plants of Greatest Ecological Concern (California Exotic Pest Plant Council, 1999; Table 9).
Table 9. Known "pest plants" observed in the Atwell Island HRS Plots. See key for an elaboration of their status as weeds.
|
Species |
CalEPPC Status 1 |
Freq. 2 |
Cover 3 |
Site cover 4 |
|---|---|---|---|---|
|
Bassia hyssopifolia |
b |
12 |
26.9 |
0.84 |
|
Brassica nigra |
b |
8 |
4.2 |
0.09 |
|
Bromus diandrus |
a |
11 |
2.1 |
0.06 |
|
Bromus madritensis subsp. rubens |
c |
50 |
0.8 |
0.10 |
|
||||
Of the listed species, only two- Bromus madritensis subsp. rubens and Bassia hyssopifolia -could be described as frequent, with only B. hyssopifolia present in any real abundance (Table 9). No species observed in the Atwell Island HRS plots were among those listed as noxious weeds by the California Department of Food and Agriculture (2001).
iii. Discussion
We do not know if species observed in areas B and C during the pre-project inventory, but not observed on the HRS plots during baseline sampling were excluded from the site or if their absence was merely short term (due to lack of appropriate conditions for germination and growth) or longer-term (due to extirpation). This should be discernable with future sampling. Seven of the 11 species were native (Appendix A, Table A4); two- Heliotropium curassavicum and Isocoma acradenia -represent taxa that are included in the restoration seed mix. This suggests that they are unsuitable for inclusion in the early stages of restoration; yet, because abundance data were not recorded during the pre-project inventory, these species may have been present in low abundance. If this were the case, their absence during baseline sampling would not be unexpected. However, it is also necessary to add the caveat that the study blocks represent only a portion of the area surveyed during the pre-project inventory. Hence, it is likely that at least some of the species not noted during baseline sampling may persist on other parts of the property.
The low floristic similarity between the two HRS sites may bode well for restoration efforts at Atwell Island. A number of the introduced species that were abundant in the Tranquillity HRS plots and adjacent lands (e.g., Sisymbrium irio , Bromus madritensis subsp. rubens , Beta vulgaris ) were much less prevalent at the Atwell Island HRS plots. In contrast, Bassia hyssopifolia -a fairly noxious weedy species-was not noted for the Tranquillity HRS plots during baseline sampling yet was fairly abundant in the Atwell Island HRS plots (Table 9). Therefore, the impression of the Atwell Island HRS as being fairly weed-free relative to the Tranquillity HRS is conditional. Furthermore, as has been seen in the Tranquillity studies, a species that is initially present in low abundance can quickly become predominant (e.g., Sisymbrium irio ).
b. Invertebrate Surveys
i. Methods
A single pitfall array was established in the center of each plot. Each array consisted of four, 3-gallon buckets connected by 20-foot sections of galvanized steel flashing (Figure 22). The buckets were sunk into the soil so that the rim of the bucket was at ground level, with the lid of the bucket situated slightly above the rim on wooden stakes. Pitfalls were opened the morning prior to the survey and remained open for approximately 24 hours before being checked. Pitfall array checks were conducted for 4 consecutive days beginning just after sunrise on 12-15 June 2001. Small mammals were counted and released from the pitfalls at the beginning of each survey. Pitfall arrays were removed after sampling so that the barley could be harvested and the treatments applied to the plots. Arrays will be reinstalled in 2002 prior to the first post-treatment sampling effort.
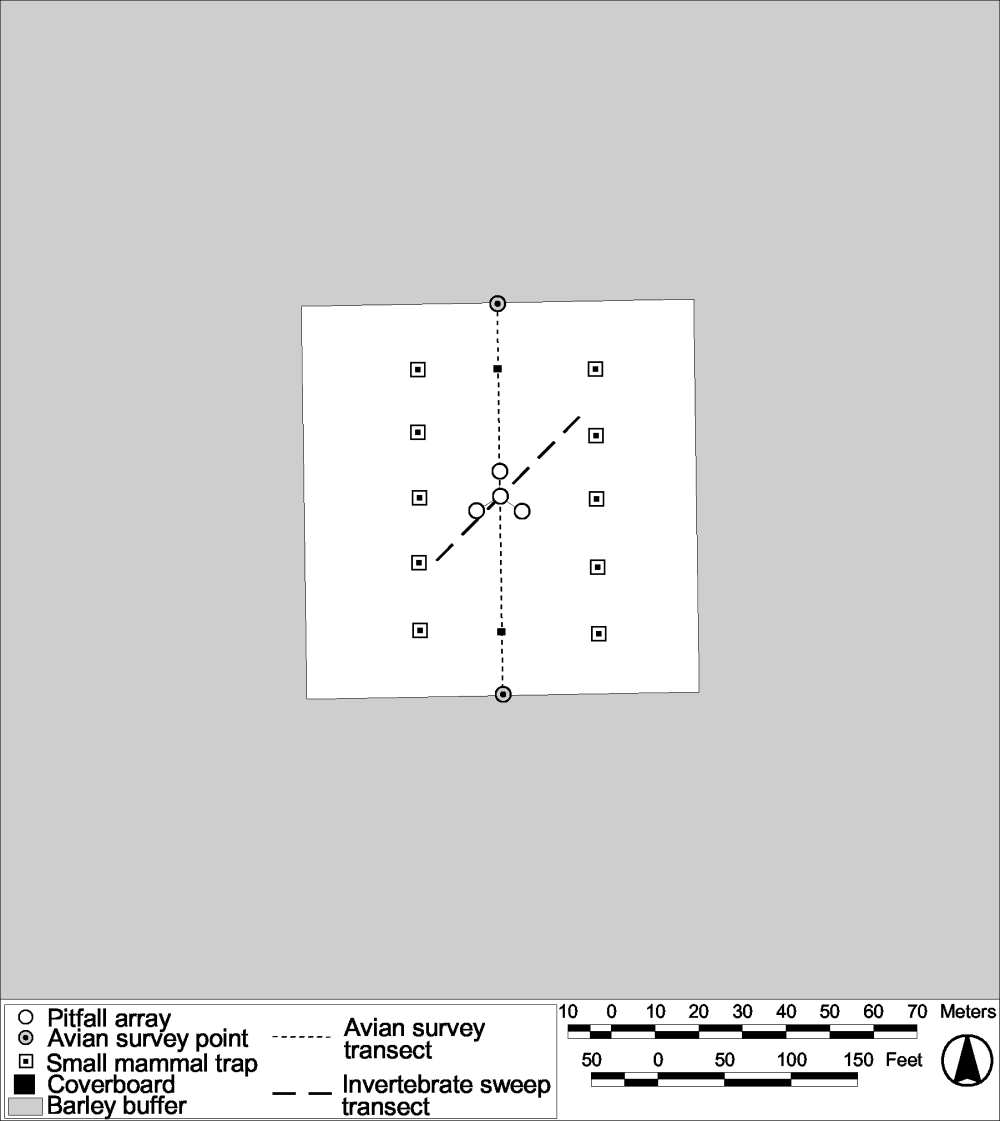
Figure 22.
Locations of pitfall arrays, sweep transects, cover boards,
avian transects, and small mammal trapping lines on an Atwell
Island HRS plot.
Sweeps of vegetation were conducted to capture invertebrates occupying the upper tier of vegetation. Vegetation sweeps were conducted on 14 and 18 June 2001. Sampling consisted of walking a 50 m long sampling transect and sweeping vegetation with an insect net 50 times. Transects were placed so that they intersected the pitfall arrays and were centered in the plots ( Figure 22 ). The same transects will be sampled in subsequent years. Invertebrates collected from the sweeps were transferred to Ziploc® bags, put on ice, and, upon arrival at the lab, frozen. Invertebrates were identified to the level of family and counted. Abundance, richness, and composition information obtained by sweep sampling is currently being analyzed.
ii. Results
Richness among the blocks was relatively constant at 13 to 16 orders per block. However, species composition varied tremendously (Table 20). Block 1 was dominated by Thysanoptera (49.7%) and Orthoptera (25.81%) whereas Block 2 was dominated by Acari (31.25%), Thysanoptera (20.47%), Isopoda (14.56%), and Araneae (13.94%). Block 3 was dominated by a single order, Coleoptera (76.84%).
Table 20. Composition (abundance of each taxa divided by the total abundance) of invertebrates collected in pitfall traps in the 3 study blocks at the Atwell Island site, 2001.
|
Order |
Block 1 |
Block 2 |
Block 3 |
|---|---|---|---|
|
Acari |
0.02 |
31.25 |
0.79 |
|
Araneae |
8.04 |
13.94 |
9.34 |
|
Blattaria |
0 |
0.09 |
0.01 |
|
Centipede |
0 |
0 |
0.23 |
|
Coleoptera |
11.94 |
7.45 |
76.84 |
|
Collembola |
0.24 |
0.05 |
0 |
|
Dermaptera |
0.38 |
0.41 |
0.55 |
|
Hemiptera |
0.48 |
0.30 |
0.18 |
|
Homoptera |
0 |
0.02 |
0.01 |
|
Hymenoptera |
2.82 |
5.46 |
0.49 |
|
Isopoda |
0.53 |
14.56 |
5.20 |
|
Lepidoptera |
0.01 |
0.02 |
0 |
|
Mantodea |
0 |
0 |
0.01 |
|
Orthoptera |
25.81 |
4.40 |
1.49 |
|
Scorpiones |
0.01 |
0.23 |
0.80 |
|
Solifugae |
0 |
0.18 |
0.02 |
|
Thysanoptera |
49.70 |
20.47 |
0.58 |
|
Thysanura |
0.01 |
1.17 |
3.47 |
iii. Discussion
Invertebrate data were collected on the study plots during the summer when the plots were covered in mature, dry barley. Treatments have since been installed on the plots and we suspect invertebrate richness and abundance will increase as more natural conditions develop on the site.
c. Amphibian and Reptile Surveys
i. Methods
Reptiles and amphibians were sampled in conjunction with the invertebrate pitfall sampling efforts and through incidental observations by field biologists when they were on the study site. In 2002 we will implement focused sampling for reptiles and amphibians by walking a single transect and by checking two cover boards that will be installed on each plot (Figure 22). The same transects will be sampled in subsequent years. Invertebrates collected from the sweeps were transferred to Ziploc® bags, put on ice, and, upon arrival at the lab, frozen. Invertebrates were identified to the level of family and counted. Abundance, richness, and composition information obtained by sweep sampling is currently being analyzed.
ii. Results
No reptiles or amphibians were captured in the pitfalls and there were no incidental sightings of reptiles or amphibians on any of the plots. Some reptiles and amphibians were observed in the vicinity of the research blocks during site-wide surveys (see section III B 2).
iii. Discussion
During baseline data gathering, the study plots were planted with a cover crop of barley that was sprinkler irrigated. Prior to the barley planting, the fields were disked. These activities and past farming operations effectively reduced the likelihood of amphibians or reptiles being present on the study plots prior to the treatments being applied.
d. Avian Surveys
i. Methods
Bird surveys were conducted on 7-9 May, 25-27 July, and, 16-18 October, 2001 in order to estimate richness, abundance, and use of the research blocks. Two census points and one north-south line transect were established in each study plot (Figure 22). The line transect traversed the space between each census point, a distance of 90m, and was walked within a 2-3 minute time period. Census data was collected at each point for 5 minutes. Avian sampling occurred for 3 consecutive mornings each quarter.
ii. Results
A total of 14 bird species were observed on the Atwell Island study plots, but the greatest species richness occurred on blocks 1 and 2 with 10 and 11 species, respectively (Table 21). Species richness on Block 1 was greatest in the spring whereas species richness on Block 2 was greatest in the fall. Only four species were observed on Block 3. Red-winged blackbirds constituted the majority of sightings on all blocks, but they were only present during the spring census when barley was present on the plots. Horned larks were very abundant on Block 2 in the fall. Western meadowlark numbers seemed to remain relatively constant across seasons and blocks. Savannah sparrows were only detected on the plots during the fall census. Four bird species of special concern were observed on the Atwell Island study blocks (Table 21), the most ubiquitous and abundant of these was the horned lark.
Table 21. Bird species observed and abundance (mean number observed per day) on the 3 study blocks at the Atwell Island site, 2001.
|
Species |
Status |
Block 1 |
Block 2 |
Block 3 |
||||||
|---|---|---|---|---|---|---|---|---|---|---|
|
Loggerhead Shrike |
CSC/FSC |
0 |
0 |
0 |
0 |
0 |
0.33 |
0 |
0 |
0 |
|
Northern Harrier |
CSC |
0 |
0 |
0 |
0 |
0 |
0.33 |
0 |
0 |
0 |
|
Long-billed Curlew |
CSC |
0 |
0.67 |
0 |
0 |
0 |
0 |
0 |
0 |
0 |
|
Western Meadowlark |
|
2.00 |
0.67 |
4.67 |
1.33 |
0.33 |
5.67 |
7.67 |
1.33 |
1.67 |
|
Western Kingbird |
|
0.33 |
0 |
0 |
0 |
0.33 |
0 |
0 |
0 |
0 |
|
Tree Swallow |
|
0 |
0 |
0 |
0 |
0 |
6.67 |
0 |
0 |
0 |
|
Savannah Sparrow |
|
0 |
0 |
0.33 |
0 |
0 |
1.67 |
0 |
0 |
0 |
|
Red-winged Blackbird |
|
69.33 |
0 |
0 |
55.00 |
0 |
0 |
107.00 |
0 |
0 |
|
Mourning Dove |
|
0.67 |
0 |
0 |
0.33 |
0 |
0 |
0 |
0 |
0 |
|
Mallard |
|
0 |
0 |
0 |
0.67 |
0 |
0 |
0 |
0 |
0 |
|
Cliff Swallow |
|
0.33 |
0 |
0 |
0 |
0 |
0 |
0 |
0 |
0 |
|
||||||||||
iii. Discussion
Although the species richness and abundance of birds on the study blocks may appear to be low, it was not surprising given the condition of the study plots. The spring census was conducted prior to barley growth, the summer census period the barley was mature, and during the fall census the barley had been harvested and the plots were covered in stubble. We believe that once restoration has occurred on the plots, bird species richness and abundance will increase.
e. Small Mammal Surveys
i. Methods
Small mammal trapping was conducted on 22-25 October, 2001 to estimate richness and abundance. Two trap lines were established within each plot, each 40 m long and containing 5 Sherman live traps spaced 10 m apart ( Figure 22 ). Traps were baited with white proso millet seed and one dry paper towel was placed in each for shredding material. Baiting of traps began approximately 1 hour before sunset and traps were checked approximately 2 hours after sunset. All animals captured were identified to species, sexed, weighed, marked by clipping fur, and reproductive status determined.
ii. Results
Although a total of 1,920 trap nights were conducted during the survey, no small mammals were captured. One pocket mouse ( Perognathus inornatus ) a Federal Species of Concern, was captured by hand on 21 October in the barley buffer north of Plot 39 on Block 3.
iii. Discussion
The complete lack of captures suggests that there were very few small mammals on the study plots when the blocks were planted in barley. Planting the cover crop (disking of the field and planting and watering the barley) in combination with past farming activities on the study blocks, likely reduced the potential for small mammals to occur.