LRDP Restoration Trial #1: Imprinting vs. Drilling of Native Seeds
- Nur Ritter (CSUS/ESRP)
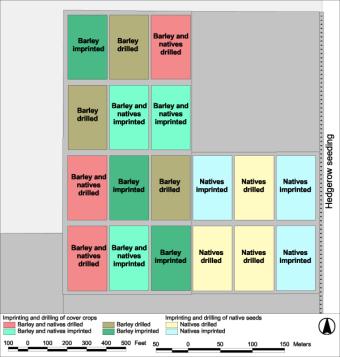
IntroductionThe Imprinting vs. Drilling of Native Seeds Trial (Figure 1) was developed to investigate planting methods that require a minimal amount of ground preparation. Tillage brings weed seed to the soil surface and breaks down soil structure. It was hoped that less soil disturbance would decrease weed density and promote the establishment of mycorrhizal networks in the soil, both of which tend to favor native plants (cf. St. John 1995). Comparisons were made between two seeding methods: imprinting and drilling. Imprinting shapes the soil, creating small depressions which concentrate water, seed, litter, and other resources (Dixon 1990). By pressing the seeds into the soil, imprinting promotes capillary contact and improves germination (Riefner et al. 1998). Imprinting is said to be particularly effective at increasing soil infiltration in arid lands (Dixon 1990; Bainbridge 2003). Drilling was accomplished using a Truax-no-till Seed Drill. This type of drill has traditionally been used for dryland farming in the midwestern U.S.; however, in recent years, the Truax drill has also been used for re-introducing native species into rangelands (Anderson & Anderson 1996; Magdoff & van Es 2000). MethodsPlots were ca. 1.5 acres in size; treatments were replicated three times (Figure 1). A mixture containing seed of nine native species (Table 1) was applied. Data were collected from eight quadrats (35 x 70 cm) per plot. Estimates of species cover and composition were obtained as described below. Installation of the experiment was undertaken in the fall of 2000; vegetation sampling was conducted the following spring (14-15 May, 2001). A stratified random sampling approach was employed, with plots divided into sub-sections and sampling points randomly selected within each section. All species were noted and the percent cover for each species estimated using a modified Daubenmire cover scale (0-1%; 1-5%; 5-25%; 25-50%; 50-75%; 75-95%; 95-100%; Bonham 1989). The total percent cover of all species within the quadrat was also estimated using the same scale. |
|
Data were entered into a FileMaker Pro database and were proofed from printed copies of the database records. Percent cover data were arcsine-transformed (cf. Fowler et al. 1990). Descriptive statistics, t-tests, and Analysis of Variance (ANOVA) procedures were performed using the software package STATISTICA (StatSoft 2002).
Species rank-abundance curves were generated for each plot and were grouped by treatment. These rank-abundance curves were plotted along the x-axis in such a way as to minimize overlap. Thus, no ordinal scale is presented along the x-axis; rather, the curves are interpreted such that the leftmost data point represents the highest (first) ranked species, with subsequent data points representing the 2nd highest ranked species, etc.
Table 1. Species planted in the Imprinting vs. Drilling of Native Species Trial, including common name, life-form, and seeding rate. Seeding rates are expressed in gross (i.e., not lbs. pure live seed) pounds per acre.
| Taxon | Family | Common Name | Life-form | Seeding Rate |
|---|---|---|---|---|
| Amsinckia menziesii | Boraginaceae | Menzie's fiddleneck | annual forb | 1.2 |
| Atriplex polycarpa | Chenopodiaceae | allscale saltbush | shrub | 9.7 |
| Hordeum depressum | Poaceae | alkali barley | annual grass | 2.4 |
| Isocoma acradenia | Asteraceae | goldenbush | shrub | 7.3 |
| Lasthenia californica | Asteraceae | California goldfields | annual forb | 1.2 |
| Leymus triticoides | Poaceae | creeping wild-rye | perennial grass | 2.4 |
| Sporobolus airoides | Poaceae | alkali sacaton | perennial grass | 2.4 |
| Suaeda moquinii | Chenopodiaceae | bush seepweed | shrub | 3.6 |
| Vulpia microstachys | Poaceae | small fescue | annual grass | 2.4 |
Results
Fifteen species were encountered during monitoring (Table 2 ). Five of these represented species included in the seed mixture; all five species were noted in both the imprinted and drilled plots. It appeared that native species were more successfully introduced by imprinting (X= 4.45%) than by drilling (X= 1.65%; p = 0.139; Figure 3). Nevertheless, with both techniques the percent cover of introduced species was more than an order of magnitude greater than that of seeded species (Figure 2; Figure 3; Figure 4). Melilotus indica (sourclover; Fabaceae) and Sisymbrium irio (London Rocket; Brassicaceae) two non-native annual herbs, were the first- and second-most abundant species in all plots. Hordeum depressum (alkali barley; Poaceae) was the most abundant imprinted species in four of the six plots (Figure 2; Figure 3; Figure 4).
Table 2. Plant species observed during vegetation monitoring of the Imprinting vs. Drilling of Native Species Trial, including letter code, family, common name, and species "category." Letter codes apply to those used in Figure 2 and Figure 3.
| Taxon | Code | Family | Common Name | Category |
|---|---|---|---|---|
| Amsinckia menziesii | A | Boraginaceae | Menzie's fiddleneck | Native - Planted |
| Atriplex argentea & A. rosea | B | Chenopodiaceae | silverscale saltbush | 'Tumbling Saltbush' |
| Capsella bursa-pastoris | C | Brassicaceae | shepherd's purse | Introduced |
| Bromus madritensis | D | Poaceae | red brome | Introduced |
| Hordeum depressum | E | Poaceae | alkali barley | Native - Planted |
| Hordeum murinum | F | Poaceae | foxtail barley | Introduced |
| Hordeum vulgare | G | Poaceae | barley | Cultivar |
| Lasthenia californica | H | Asteraceae | California goldfields | Native - Planted |
| Leymus triticoides | I | Poaceae | creeping wild-rye | Native - Planted |
| Melilotus indica | J | Fabaceae | sourclover | Introduced |
| Phalaris minor | K | Poaceae | littleseed canarygrass | Introduced |
| Salsola tragus | L | Chenopodiaceae | Russian thistle | Introduced |
| Sisymbrium irio | M | Brassicaceae | London rocket | Introduced |
| Unknown Atriplex | N | Chenopodiaceae | Not Known | |
| Vulpia microstachys | O | Poaceae | small fescue | Native - Planted |
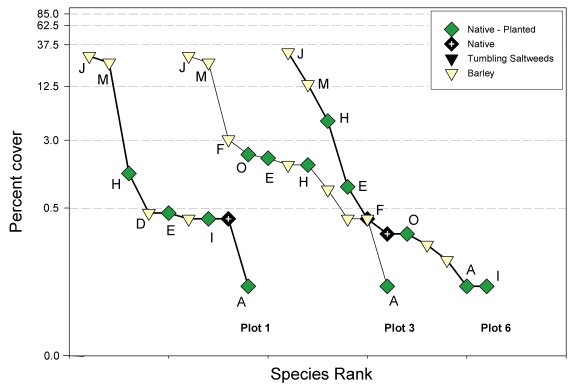
Figure 2. Species rank-abundance for the imprinted plots (Imprinting vs. Drilling of Native Species Trial). Species letter codes correspond to those presented in Table 2. The five most abundant species in each plot and all native species are identified by letter code. Values along the Y-axis are the midpoints of the sampling cover classes.
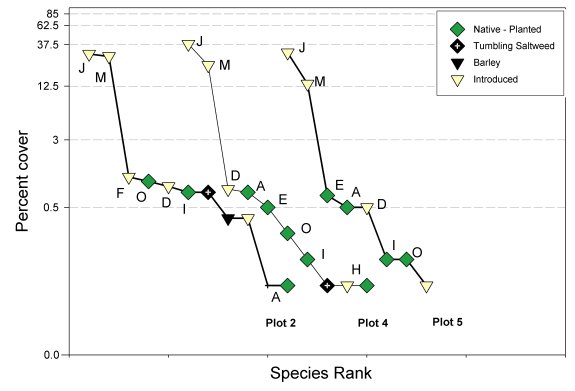
Figure 3. Species rank-abundance for the drilled plots (Imprinting vs. Drilling of Native Species Trial). Species letter codes correspond to those presented in Table 2. The five most abundant species in each plot and all native species are identified by letter code. Values along the Y-axis are the midpoints of the sampling cover classes.
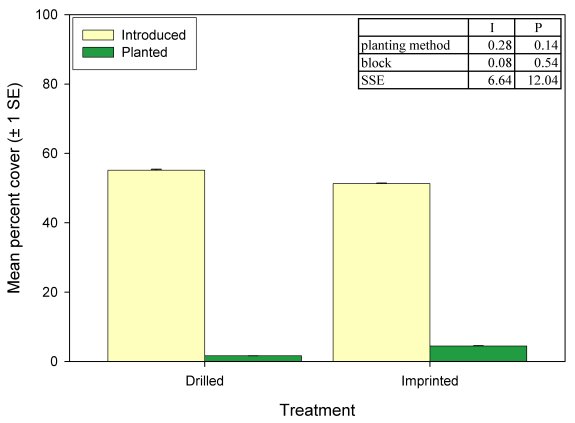
Figure 4. Mean percent cover of planted and non-planted species in the Imprinting vs. Drilling of Native Species Trial. Key to species classes: I, Introduced; P, Planted. Data in rows 1-2 are p-values. Note: error bars are not readily evident because standard errors were smaller than can be clearly differentiated from the bars.
Discussion
The extremely low percent cover of the planted species relative to non-planted species (Figure 2; Figure 3; Figure 4) suggests that weed control needs to be a primary focus of restoration efforts on the retired agriculture lands. By the year following initiation of the trial, all plots were dominated by introduced species. It is also noteworthy that the seed bank contributed little to native species establishment, with an unknown species of Atriplex potentially the sole non-seeded native species encountered during monitoring (Table 2).
As noted, three species from the seed mixture were not observed during vegetation monitoring. These species-Atriplex polycarpa, Isocoma acradenia, and Sporobolus airoides-germinate in late spring; hence, their absence in this experiment most likely was due to competitive exclusion by winter-germinating weeds. Still, all three species have been successfully grown in the native plant nursery, and the latter two species were successfully established in subsequent trials. Therefore, the poor performance of those species in this trial should not be interpreted as an indication of their general unsuitability for restoration efforts. Rather, their poor establishment in this trial should be considered within the context of local conditions during a poor hydrologic year.
References
Anderson, J. H. and J. L. Anderson. 1996. Establishing permanent grassland habitat with California native perennial grasses. Valley Habitats 14:1-12
Bainbridge, D. A. 2003. New hope for desert lands. 2003 Arid Southwest Lands Habitat Restoration Conference. Palm Springs, CA. 20 pp.
Bonham, C. 1989. Measurements for Terrestrial Vegetation. John Wiley & Sons, New York, New York. 338 pp.
Dixon, R. M. 1990. Land imprinting for dryland revegetation and restoration. pp. 14-22. In: Environmental Restoration: Science and Strategies for Restoring the Earth. Berger, J. J. (ed.) . Island Press, Covelo.
Fowler, J., L. Cohen and P. Jarvis 1998. Practical Statistics for Field Biology. John Wiley & Sons. Ltd., West Sussex, England. 259 pp.
Magdoff, F. and H. van Es. 2000. Building Soils for Better Crops. Sustainable Agricultural Network, Washington, D.C.
Riefner, R., D. Pryor and T. St. John. 1998. Restoration at San Onofre State Beach, California. Land and Water 42: 15-17.
St. John, T. 1995. Specially-modified land imprinter inoculates soil with mycorrhizal fungi. Restoration Management. Notes 14: 84-85.
StatSoft, Inc. 2002. STATISTICA (data analysis software system), version 6. www.statsoft.com.
Uptain, C. E., K. Dulik, P. Brandy, M. Selmon, P. A. Kelly, D. F. Williams, S. L. Lee and J. Brummer. 2001. Land Retirement Demonstration Project Year Two. 2000 Annual Report. Endangered Species Recovery Program, Fresno, CA. 124 pp.
Page created: Dec. 5, 2005; Last updated: March 26, 2007