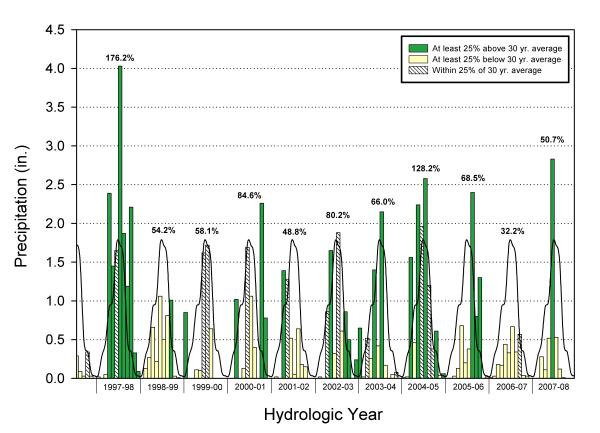
Figure 1. Precipitation during the course of the Land Retirement Demonstration Project (1997-2005) and the duration of native plant propagation activities (2001-2008).
Bars represent monthly totals; the solid line represents the 30-year mean precipitation.