|
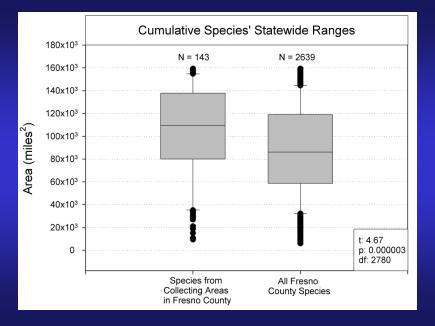
One explanation for the generally low number of occurrences of the 151 species considered in these analyses is that they have limited distributions (i.e., it should be expected that they would be encountered infrequently). Here, we compare the mean distribution (in California) of the species from our Fresno County collecting areas (143 spp.) with the mean distribution of all species listed for Fresno County in CalFlora. It is clear that the species that the from our Fresno County sites possess a greater than average distribution. |
|